

In this article, we will explore how to calculate standard deviation in Excel, a powerful tool widely used for data analysis and statistical calculations.
By following the step-by-step instructions below, you will gain the confidence to perform standard deviation calculations effectively and efficiently.
Whether new to Excel or seeking to enhance your statistical skills, this article will equip you with the knowledge and techniques to analyze and interpret data confidently.
Let's get started!
Table of Contents
- What is standard deviation
- How to find standard deviation in Excel
- Functions to calculate population standard deviation in Excel
- Which Excel standard deviation function to use
- Excel standard deviation formula examples
- FAQs
- Final Thoughts
What is Standard Deviation
Standard deviation is a way to measure how spread out or close together the numbers in a set of data are. It helps us understand if the data's average, or mean, is a good representation of the entire dataset.
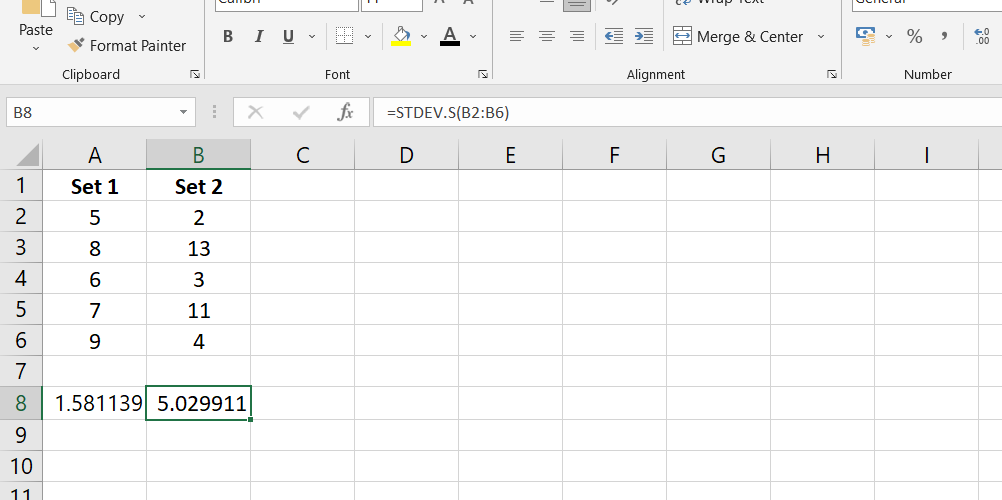
Imagine you have a group of numbers, like 5, 8, 6, 7, and 9. The mean of these numbers is 7, which is right in the middle. But what if the numbers were 2, 13, 3, 11, and 4?
The mean is still 7, but the numbers are more spread out, so the mean might not tell the whole story.
That's where standard deviation comes in. It tells us how much the numbers deviate or move away from the mean.
If the standard deviation is small, the numbers are close to the mean, and the mean represents the data well. If the standard deviation is large, the numbers are more spread out, and the mean might not be as reliable.
Let's take the example of the first set of numbers: 5, 8, 6, 7, and 9. The standard deviation is small because the numbers are close to the mean of 7.
But in the second set of numbers: 2, 13, 3, 11, and 4, the standard deviation is larger because the numbers are more spread out.
How to Find Standard Deviation in Excel
To calculate standard deviation in Excel, you can use six different functions. The choice of function depends on whether you're working with the entire population or a sample of data.
For calculating the standard deviation based on a sample, you can use the following formulas:
-
Excel STDEV function: This is the oldest function and works in all versions of Excel from 2003 to 2019. It can accept up to 255 arguments, which can be numbers, arrays, named ranges, or references to cells containing numbers.
However, in Excel 2003, it can only accept up to 30 arguments.
- Excel STDEV.S function: This improved version was introduced in Excel 2010. Like STDEV, it calculates the sample standard deviation based on the classic formula.
- Excel STDEVA function: This function is similar to STDEV and STDEV.S but handles logical and text values differently. Logical values are counted as 1 for TRUE and 0 for FALSE, and text values are counted as 0.
It's important to note that these functions require at least two numeric values to work correctly, otherwise, an error may be returned.
Functions to calculate population standard deviation in Excel
Excel provides three functions to calculate the population standard deviation if you're working with the entire population.
- Excel STDEVP function: This is the older function used to find the standard deviation of a population. It works in all versions of Excel and accepts multiple arguments, which can be numbers, arrays, or references to cells containing numbers.
- Excel STDEV.P function: This modern version introduced in Excel 2010 is recommended for better accuracy. It also calculates the population standard deviation. Like the sample standard deviation functions, it counts only numbers within arrays or reference arguments. The list of arguments, it also counts logical values and text representations of numbers.
- Excel STDEVPA function: This function calculates the population standard deviation and includes text and logical values. It behaves similarly to the STDEVA function for non-numeric values.
It's important to note that these functions may return an error if any error values or text cannot be interpreted as numbers within the arguments.
Which Excel standard deviation function to use
Choosing the right standard deviation function in Excel can sometimes be confusing, but by answering a few questions, you can easily determine which one to use:
Are you calculating standard deviation for a sample or a population?
- If it's for a sample: Use the STDEV.S function in Excel 2010 and later, or STDEV in Excel 2007 and earlier.
- If it's for a population: Use the STDEV.P function in Excel 2010 and later, or STDEVP in Excel 2007 and earlier.
What version of Excel are you using?
- If you have Excel 2010 or later, use the STDEV.S or STDEV.P functions, respectively.
- If you have Excel 2007 or earlier, use the STDEV or STDEVP functions.
Does your data set include only numbers, or does it include logical values and text as well?
- If your data set includes logical values or text that you want to include in the calculation, use the STDEVA function for a sample or STDEVPA function for a population. However, these functions may not be useful and are commonly used within larger formulas.
Excel standard deviation formula examples
Let's see some examples of how to use Excel formulas to calculate standard deviation:
Example 1: Calculating population standard deviation
Imagine you have a set of data representing the heights of students in a class. The data is in cells B2 to B50. To calculate the population standard deviation, you can use the formula:
=STDEV.P(B2:B50)
This formula tells Excel to calculate the standard deviation for the entire population of values in cells B2 to B50.
Example 2: Calculating sample standard deviation
Now let's say you have a sample of data representing the weights of a group of animals. The sample is in cells B2 to B10. To calculate the sample standard deviation, you can use the formula:
=STDEV.S(B2:B10)
This formula tells Excel to calculate the standard deviation for the sample of values in cells B2 to B10.
In older versions of Excel (2007 and lower), the formulas are slightly different:
For population standard deviation, use:
=STDEVP(B2:B50)
For sample standard deviation, use:
=STDEV(B2:B10)
By using these formulas in Excel, you can easily calculate the standard deviation of your data. It helps you understand the variability or spread of values and make more informed decisions based on the data.
FAQs
How to calculate standard deviation in Excel?
To calculate standard deviation in Excel, use the STDEV.S function for a sample or the STDEV.P function for a population.
Should I use STDEV S or STDEV P in Excel?
Use STDEV.S for a sample when you want to estimate the standard deviation of a subset, and use STDEV.P for a population when you have data for the entire population.
What is the difference between STDEV P and STDEV S?
STDEV.P calculates the standard deviation for a population, considering all the data, while STDEV.S calculates the standard deviation for a sample, representing a portion of the population.
What does standard deviation represent in Excel?
Standard deviation in Excel represents the measure of how values in a dataset deviate from the mean, indicating the spread or variability of the data.
What does standard deviation tell you?
Standard deviation tells you how much the data points deviate from the mean, giving you an idea of the dispersion or variation within the dataset. A higher standard deviation indicates more variability, while a lower standard deviation indicates less variability.
Final Thoughts
Standard deviation in Excel is a useful tool for understanding data spread and assessing its variability. With the various functions available, you can easily calculate the sample and population standard deviation.
By interpreting the standard deviation, you gain insights into the consistency and reliability of your data.
Excel simplifies finding the standard deviation, empowering you to make informed decisions based on data analysis.
One more thing
If you have a second, please share this article on your socials; someone else may benefit too.
Subscribe to our newsletter and be the first to read our future articles, reviews, and blog post right in your email inbox. We also offer deals, promotions, and updates on our products and share them via email. You won’t miss one.
Related Articles
» How to Calculate Standard Deviation in Excel
» How to Add Standard Deviation Bars in Excel
» How To Calculate a P-Value in Excel