
No need to rely on pre-printed graph paper when you can create your own in Excel. The advantage? You can customize the size, color, and layout to suit your preferences.
Plus, you'll have the convenience of printing as many copies as you need, whenever you need them. So let's dive into this step-by-step guide and learn how to print graph paper in Excel.
Table of Contents
- Create a Graph Paper in Excel
- Print the Graph Paper in Excel
- Optimal Tips for Printing Graph Paper in Excel
- Common Problems when Printing Graph Paper in Excel
- FAQs
- Final Thoughts
Create a Graph Paper in Excel
To create a graph paper in Excel, follow these steps:
- Select all the cells in the worksheet by clicking on the top left corner or using the Ctrl + A keyboard shortcut.
-
Go to the "Home" tab and find the "Format" drop-down menu in the Cells group.

-
Click on "Column Width" from the drop-down menu. In the column width field, enter "3" and click OK to save. This will adjust the width of the columns to create square boxes resembling graph paper.

- You now have graph paper-like boxes in your worksheet.
- Open the print preview by pressing Ctrl + P. Click on "Page Set Up" to customize the print settings.
-
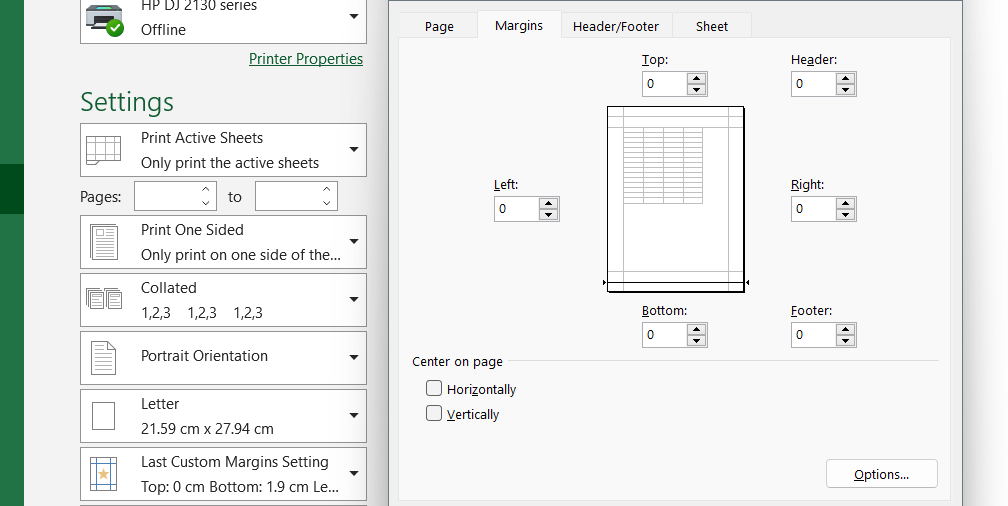
In the "Margin" tab of the page setup dialog, set the header and footer to 0 and adjust the top, bottom, left, and right margins to 0 or 0.5 to maximize the space for the graph paper.
-
Check both checkboxes under "Center on page" to ensure the graph paper is centered when printed.

-
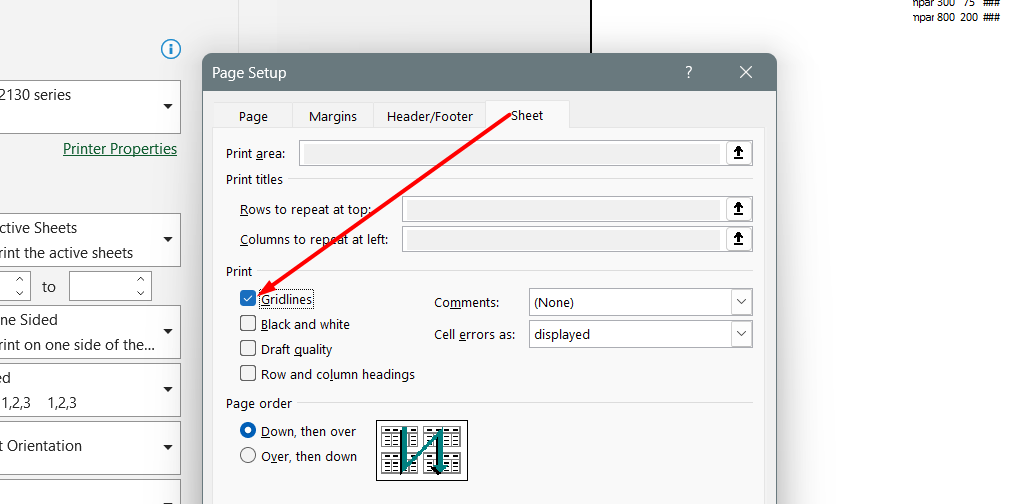
Switch to the "Sheet" tab in the page setup dialog. Under the "Print" group, tick the "Gridlines" option to include the gridlines when printing the graph paper.
-
Click OK to save the changes.
Now you have set up the graph paper in Excel and are ready to print it. Simply send the worksheet to your printer, and you'll have your custom graph paper ready to use for various tasks.
Print the Graph Paper in Excel
To print the graph paper in Excel, follow these steps:
- Open your worksheet and ensure that you have set up the graph paper template as described in the previous instructions.
-
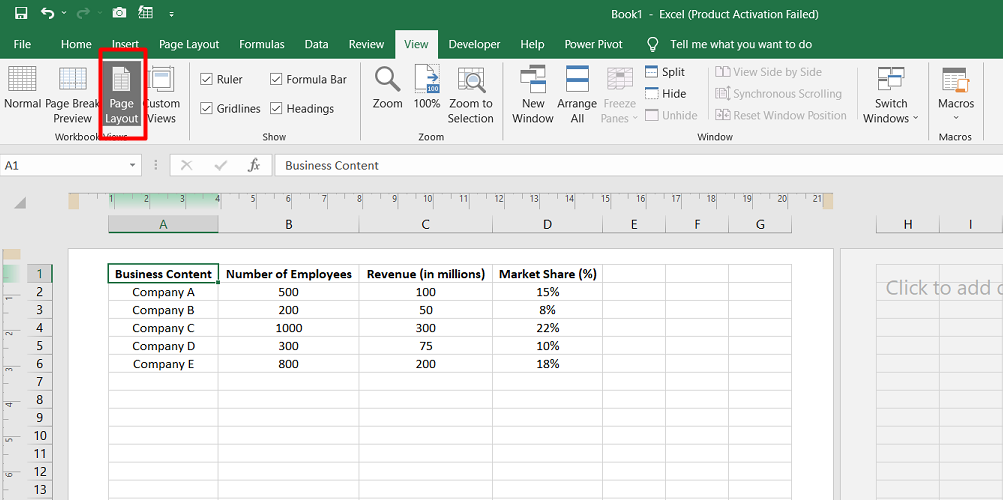
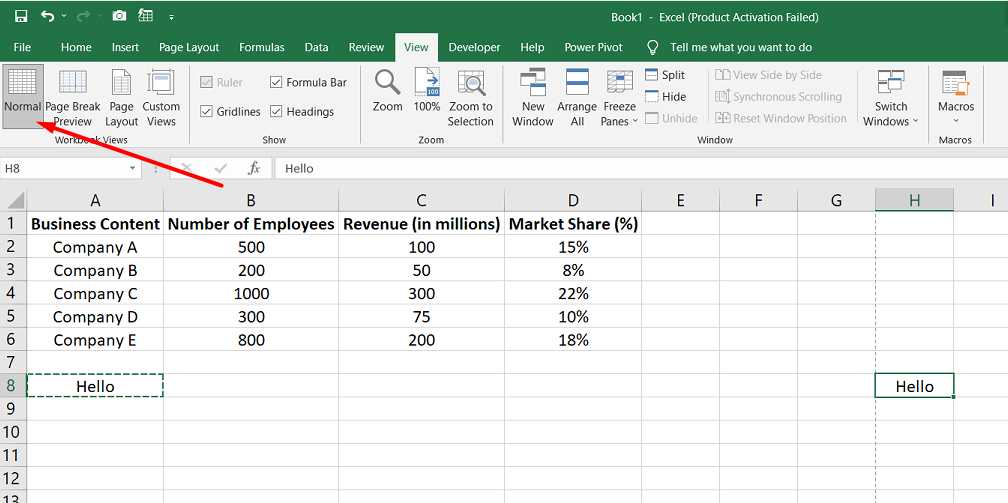
Click on the "View" tab and select the "Page Layout" button. This will switch to the Page Layout view, where you can make adjustments for printing.
- Enter a space or any character in the first cell of the worksheet. Then, copy and paste this space to fill the cells on the single page. This is necessary because Excel will not print a completely blank sheet.
-
Go back to the "View" tab and click on the "Normal" view button to return to the normal worksheet view.
-
To preview the printout, go to the "File" tab and select the "Print" option, or use the shortcut Ctrl + P to open the print preview.

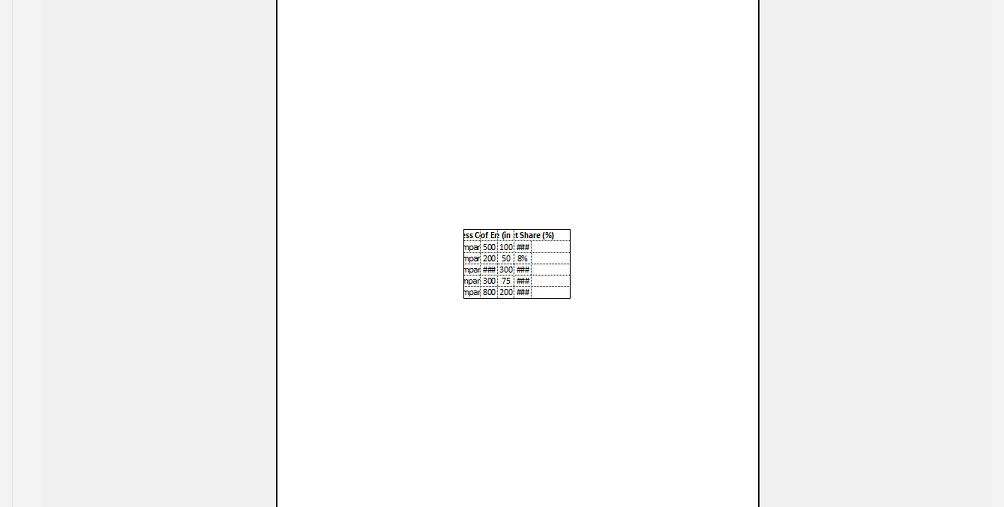
- In the print preview, you will see the graph paper with the gridlines and the added spaces.
-
Once you are satisfied with the preview, click the print button to print the graph paper. Alternatively, you can choose to save the Excel workbook as a PDF file by selecting "File" → "Export" → "Create PDF/XPS Format" → "Create PDF/XPS Format".

By following these steps, you can successfully print the graph paper you created in Excel, ready to use for your projects or calculations.
Optimal Tips for Printing Graph Paper in Excel
Here are some tips and tricks to ensure optimal results when printing graph paper in Excel:
Avoid Page Breaks
To prevent unwanted page breaks within the graph paper, adjust the column widths and row heights to fit within a single page. This will ensure that the gridlines and squares remain intact without being split across multiple pages.
Set Print Area
Define the print area in Excel to include only the cells containing the graph paper template. This helps in avoiding any unnecessary printing of empty cells or additional content outside the graph paper.
Adjust Scaling
If the graph paper template doesn't fit perfectly on a single page, consider adjusting the scaling options in the print settings. You can scale the worksheet to fit within the desired paper size, ensuring that the gridlines and squares maintain their proportions.
Use Page Layout View
Switch to the Page Layout view in Excel to get a better visual representation of how the graph paper will appear when printed. This allows you to make any necessary adjustments to the layout, such as adjusting margins or adding headers and footers.
Print Gridlines
Ensure that the "Gridlines" option is selected in the print settings. This will ensure that the gridlines of the graph paper are included in the printout, providing a clear and visible grid for your use.
By following these tips and tricks, you can optimize your printing of graph paper in Excel, ensuring that the resulting printouts accurately represent the intended grid and layout for your projects or calculations.
Common Problems when Printing Graph Paper in Excel
When printing graph paper in Excel, some common problems that users may encounter include:
- Alignment issues: The gridlines or cells may not align properly when printed, resulting in a skewed or misaligned graph paper.
- Scaling problems: The graph paper may not be scaled correctly when printed, leading to squares that are too large or too small, or uneven spacing between the gridlines.
- Page breaks: If the graph paper template spans multiple pages, there might be unwanted page breaks that disrupt the continuity of the grid when printed.
- Missing gridlines: In some cases, the gridlines may not appear on the printed version, even though they are visible on the screen.
- Margins and spacing: The margins or spacing settings may not be adjusted correctly, causing the graph paper to be cut off or not centered properly on the printed page.
To mitigate these problems, it is important to review and adjust the print settings, page layout, and scaling options in Excel before printing. Testing the print preview, adjusting margins, and ensuring proper alignment can help in achieving the desired result when printing the graph paper.
FAQs
How do I print grid paper?
To print grid paper, you can either download and print pre-made grid paper templates available online or create your own in Excel and then print it.
How do I make a graph sheet in Excel?
To make a graph sheet in Excel, you can create a square grid by adjusting the column width and row height to be the same, or you can use the built-in gridlines feature to display a grid on the worksheet.
How do you add squares to a graph in Excel?
To add squares to a graph in Excel, you can use the "Shapes" option from the "Insert" tab to draw square shapes onto the graph or create a custom grid using cells and borders.
How do you graph a square function?
To graph a square function in Excel, you can create a table of x-values, calculate the corresponding y-values by squaring the x-values, and then use the charting feature to plot the points and create the graph.
How do I make a 1 inch grid in Excel?
To make a 1 inch grid in Excel, you can adjust the column width and row height to be equivalent to 1 inch measurements or use the "Page Layout" tab to set the print area to a 1 inch by 1 inch grid and then print it.
Final Thoughts
In conclusion, printing a graph paper in Excel allows for easy customization and convenience. By following the step-by-step guide, you can create a square grid template that suits your specific needs.
Whether it's for mathematical calculations, design projects, or graph plotting, Excel provides the tools to generate the perfect graph paper. Remember to adjust the column width and row height, set up the printing options, and add content to avoid printing blank sheets.
One more thing
If you have a second, please share this article on your socials; someone else may benefit too.
Subscribe to our newsletter and be the first to read our future articles, reviews, and blog post right in your email inbox. We also offer deals, promotions, and updates on our products and share them via email. You won’t miss one.
Related articles
» How To Print Gridlines in Excel
» How to Create a Bar Graph in Excel
» How to Make a Line Graph in Excel - Step by Step Guide