
Are you looking to filter and analyze data in your Excel Pivot Table? One of the most effective tools for this task is a slicer.
In this article, we will explore a pivot table, how it differs from a regular table, and how a slicer can enhance your data filtering experience. We will also provide step-by-step instructions on inserting a slicer in a Pivot Table and using it to filter data effectively.
Discover the benefits of using a slicer in your Pivot Table analysis!
Key Takeaways:
-
Use a slicer in a Pivot Table to easily filter data and make quick comparisons.
-
Insert a slicer by clicking on the PivotTable and selecting fields in the Insert Slicers dialog box.
-
Take advantage of a slicer's benefits, such as interactive data filtering, customization options, and improved data analysis.
What is a Pivot Table
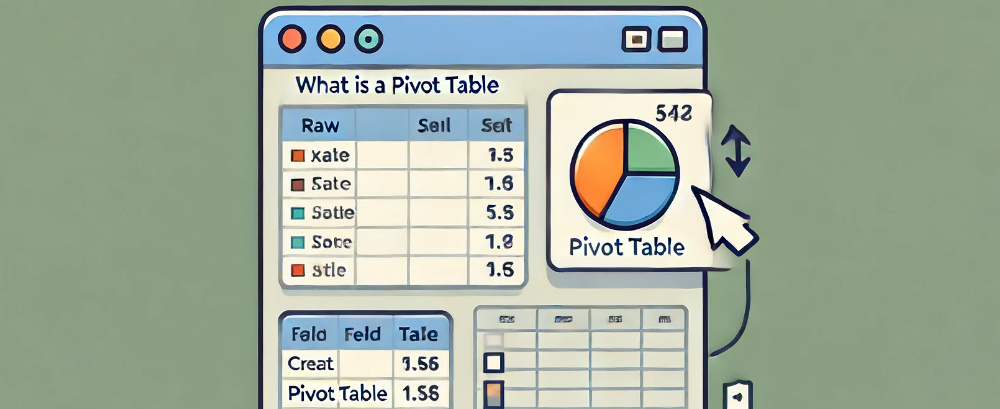
A PivotTable in Excel is a powerful tool that allows users to summarize, analyze, explore, and present large amounts of data in a cohesive and interactive format. This makes it easier to derive insights and trends from your data.
How is a Pivot Table Different from a Regular Table?
A PivotTable differs from a regular table in Excel by offering dynamic data summarization capabilities. It allows users to reorganize and pivot data fields to explore different views and insights, which is impossible with static regular tables.
Interactive by nature, PivotTables possess a distinct advantage over traditional static tables. Users can manipulate data effortlessly by sorting, filtering, and grouping without affecting the original dataset structure, enabling a fluid exploration of data trends and patterns.
What is a Slicer in a Pivot Table
A Slicer in a PivotTable is a visual filter component in Excel that allows users to filter data dynamically by selecting values directly from a simple, user-friendly interface, enhancing data analysis and presentation.
How Does a Slicer Help in Filtering Data?
Slicers help filter data in a Pivot Table by providing an intuitive interface where users can click buttons representing specific field values to filter and display only the relevant data instantly.
This interactive feature enhances the user experience by offering a visual representation of available filter options, making it easier to identify and select desired criteria. Unlike traditional filter dropdown menus, Slicers allow quicker navigation and selection, reducing the time spent searching for specific values.
Clearing filters is a simple task with Slicers, as users can reset selections with just a click, providing a seamless way to modify views. The flexibility of using multiple Slicers together allows for more intricate data analysis, enabling users to refine and explore data from various perspectives.
How to Insert a Slicer in a Pivot Table
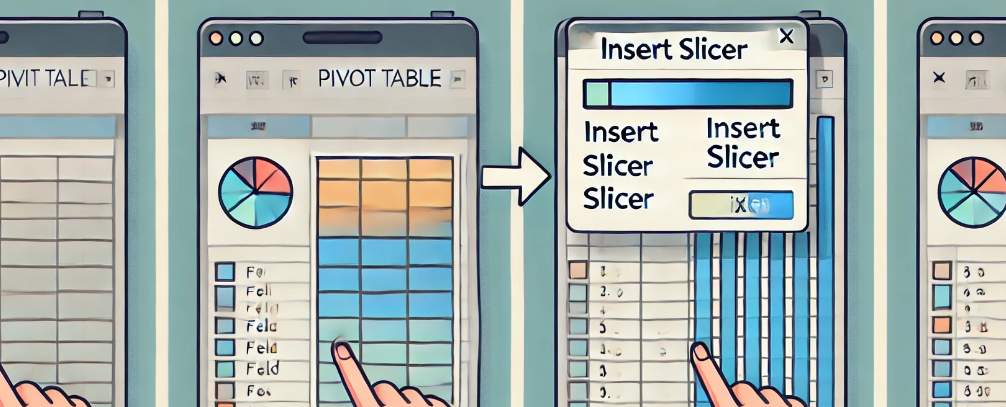
Inserting a Slicer in a PivotTable involves a few straightforward steps in Excel, starting with selecting the PivotTable, then navigating to the PivotTable Analyze tab, and finally using the Insert Slicer option to choose the fields you want to filter.
Step 1: Click on the PivotTable
To insert a Slicer, click anywhere within the PivotTable to ensure it is selected and activated for further actions.
Selecting the PivotTable first tells Excel that your next operation will be related to this data set. This simple step is crucial because it activates the 'Analyze' and 'Design' tabs in the Excel ribbon, which are specific to PivotTables. This facilitates the seamless insertion of a Slicer.
If you do not select the PivotTable beforehand, these tabs remain dormant, limiting your options for manipulating and visualizing the data.
Step 2: Show the PivotTable Tabs
After clicking on the PivotTable, the PivotTable tabs, which are PivotTable Analyze and Design, will appear on the ribbon, providing various tools and options for customization.
These two tabs are crucial in managing the data within the Pivot Table. The PivotTable Analyze tab offers functions for restructuring and summarizing the data, such as sorting, filtering, and grouping.
On the other hand, the Design tab focuses on the visual aspects, allowing users to change the Pivot Table's layout, styles, and formatting.
These tabs become essential when inserting a Slicer into the Pivot Table to filter data dynamically. The options provided within the Analyze and Design tabs enable users to refine the data presentation, apply different calculations, and enhance the overall clarity and aesthetics of the Pivot Table.
Step 3: Click on PivotTable Analyze > Insert Slicer
In the PivotTable Analyze tab, locate the Insert Slicer button and click on it to open the Insert Slicers dialog box, where you can select the fields for your Slicer.
Once you click the Insert Slicer button, a list of available fields will be displayed in the Insert Slicers dialog box. By checking the boxes, you can then choose the specific field or fields you want to use as a Slicer.
After selecting the desired fields, click the 'OK' button to apply the Slicer to your Pivot Table. The Slicer will now appear on your Excel worksheet, providing a user-friendly way to filter and interact with your data.
Step 4: Select the Fields for the Slicer
In the Insert Slicers dialog box, check the boxes next to the fields you want to create Slicers for, and then click OK to insert the Slicers into your PivotTable.
When selecting the fields in the Insert Slicers dialog box, choosing those fields will provide you with the most valuable insights and simplify the data analysis process is crucial. By checking the checkboxes next to the relevant fields, you essentially tell Excel which data points you want to filter and visualize using Slicers.
Choosing the right fields ensures that your Slicers are aligned with your analytical goals and helps you refine your data views efficiently. Opting for redundant or irrelevant fields can clutter your interface and make the data exploration process more cumbersome.
How to Use a Slicer to Filter Data in a Pivot Table
To use a Slicer to filter data in a PivotTable, you need to interact with the Slicer interface by selecting the desired filter criteria. The slicer will dynamically adjust the data displayed in the PivotTable to match your selection.
Step 1: Click on the Slicer
Click on the Slicer to activate it, which will bring up the filter options associated with the field you have chosen for the Slicer.
When you activate the Slicer by clicking on it, you unlock various filter options tailored to the specific data within that field. This provides a powerful tool for refining and manipulating the displayed information quickly and efficiently.
Engaging with the Slicer allows you to sort through data based on your preferences and criteria, allowing for a more nuanced and customizable dataset analysis. Make sure to utilize this feature to streamline your data exploration process and easily extract meaningful insights.
Step 2: Select the Data to Filter
Click on the relevant buttons within the Slicer to select the data you wish to filter. The Slicer will automatically filter the data displayed in the PivotTable.
Once you have selected a specific filter option, observe how the data in the Pivot Table adapts immediately to reflect only the chosen criteria. This dynamic feature lets you interact with your data in real-time, gaining instant insights matching your preferences.
Step 3: Click on the Filter Button
Once you have selected the desired filter criteria in the Slicer, click the filter button to apply the filter and update the PivotTable data accordingly.
Upon clicking the filter button, the PivotTable will dynamically adjust its displayed information to match the selected criteria from the Slicer. This results in a real-time reflection of the data you want to focus on, making it easier to spot trends and patterns.
Filtering streamlines the data presentation and facilitates a more targeted analysis of the information available within the Pivot Table.
Step 4: Adjust the Slicer Settings
Adjust the Slicer settings by accessing the Slicer Tools options on the ribbon, where you can format the Slicer, change its size, and customize its appearance to better fit your report.
When you click on the 'Slicer Tools' tab, you will find a range of features that allow you to refine the look and feel of your slicers. One of the key aspects you can modify is the layout, which lets you select the arrangement of slicers on your sheet.
You can experiment with different colors and styles to match your slicer with the overall theme of your document. Utilizing these customization options can significantly elevate the visual appeal of your reports.
The Benefits of Using a Slicer in a Pivot Table

Using a Slicer in a PivotTable offers numerous benefits, such as easy and interactive data filtering, quick data comparisons, extensive customization options, and improved overall data analysis capabilities.
Easy and Interactive Data Filtering
Slicers provide a user-friendly and interactive way to filter data in a Pivot Table, allowing users to quickly and easily adjust their data views with just a few clicks.
Imagine you are presenting a quarterly sales report to your team. With Slicers, you can effortlessly showcase different scenarios by simply clicking on the desired filters.
For instance, in real-time, you can compare sales figures between different regions, product categories, or time periods. This dynamic feature not only enhances the clarity of your presentation but also encourages audience engagement and participation.
Quick Comparison of Data
Slicers enable quick comparison of different data sets by allowing users to swiftly switch between various filter criteria and observe the changes in the Pivot Table.
This feature proves invaluable when analyzing extensive datasets, enabling users to identify trends and patterns more efficiently. Users can swiftly pinpoint outliers or commonalities among various data subsets by toggling between different filter options.
The ability to visualize data dynamically contributes to a more holistic understanding of the information presented. Quick comparisons facilitated by Slicers save time and enhance the ability to derive meaningful insights from the data.
Customization Options
Slicers offer extensive customization options, including changing the color style, resizing, adjusting borders, and modifying the format to align with the overall design of your report.
Changing the color style of your Slicer can help in highlighting specific elements or matching the color scheme of your report.
Resizing the Slicer allows you to adjust its dimensions to fit the layout better.
Adjusting borders can create a cleaner or more prominent visual separation between the Slicer and the rest of your content.
Modifying the format, such as the font style or size, can ensure consistency in your report's overall look and feel.
Improved Data Analysis
Using Slicers in a Pivot Table significantly improves data analysis by providing immediate visual feedback and making it easier to segment and explore different aspects of the data.
This tool acts as a filtering mechanism within the PivotTable, allowing users to analyze and understand the data more effectively and dynamically. Users can quickly drill down into specific categories or subsets of data by simply clicking on different options within the Slicer, gaining valuable insights.
By utilizing Slicers, analysts can easily spot trends, patterns, and outliers in the dataset, leading to more well-considered choice processes. Consider a sales report where multiple variables like region, product type, and salesperson must be analyzed.
With Slicers, one can isolate regions or products to delve deeper into performance metrics, aiding in identifying key drivers for sales success.
Frequently Asked Questions
How do I filter data in a Pivot Table in Excel using slicers?
To filter data in a Pivot Table in Excel using slicers, follow these steps: 1. Click anywhere in the PivotTable to show the PivotTable tabs (PivotTable Analyze and Design) on the ribbon. 2. Click PivotTable Analyze > Insert Slicer.
3. In the Insert Slicers dialog box, check the boxes of the fields you want to create slicers for. 4. Click OK.
Can I use multiple slicers to filter data in a Pivot Table in an Excel table?
You can use multiple slicers to filter data in a Pivot Table in an Excel table. Simply check the boxes of the fields you want to create slicers for in the Insert Slicers dialog box.
How can I remove a slicer from a Pivot Table in an Excel table?
To remove a slicer from a Pivot Table in an Excel table, click on the slicer and press the delete key on your keyboard. Alternatively, you can right-click on the slicer and select "Remove" from the menu.
Are there other ways to filter data in a Pivot Table in an Excel table besides using slicers?
Yes, in addition to using slicers, you can filter data in an Excel pivot table by using the filter drop-down menus in the PivotTable fields or the filter buttons on the PivotTable Analyze tab.
Can I customize the appearance of slicers in a Pivot Table in an Excel table?
Yes, you can customize the appearance of slicers in a Pivot Table in Excel by right-clicking on the slicer and selecting "Slicer Settings" from the menu. You can change the slicer's color, size, and other display settings here.
Is there a limit to the number of fields I can create slicers for in a Pivot Table in an Excel table?
No, there is no limit to the number of fields you can create slicers for in a Pivot Table in Excel. You can create slicers for as many fields as you need to filter your data effectively.
Final Thoughts
We explored how to filter data in a Pivot Table using slicers. We covered the basics of Pivot Tables, the function of slicers, and step-by-step instructions on inserting and using slicers effectively.
Now that you know how to enhance your data analysis with slicers, try implementing these techniques in your next Excel project. Don't forget to customize your slicers to make your data filtering more interactive and insightful.
Let's combine it and make your data analysis more efficient and dynamic.