When it comes to Excel for professionals, the vast array of functions can be overwhelming, especially for those starting with data analysis. With over 475 functions available, it's challenging to determine the right one for specific tasks.
That's why we're here to help.
This resource has identified the 12 most useful Excel functions for data analysis. These functions are the go-to tools that simplify complex tasks, saving time and effort.
Table of Contents
IF
To use the IF function, you provide three arguments: the logical test, the value to return if the test is true, and the value to return if the test is false. This enables you to create dynamic formulas that adapt based on specific conditions.
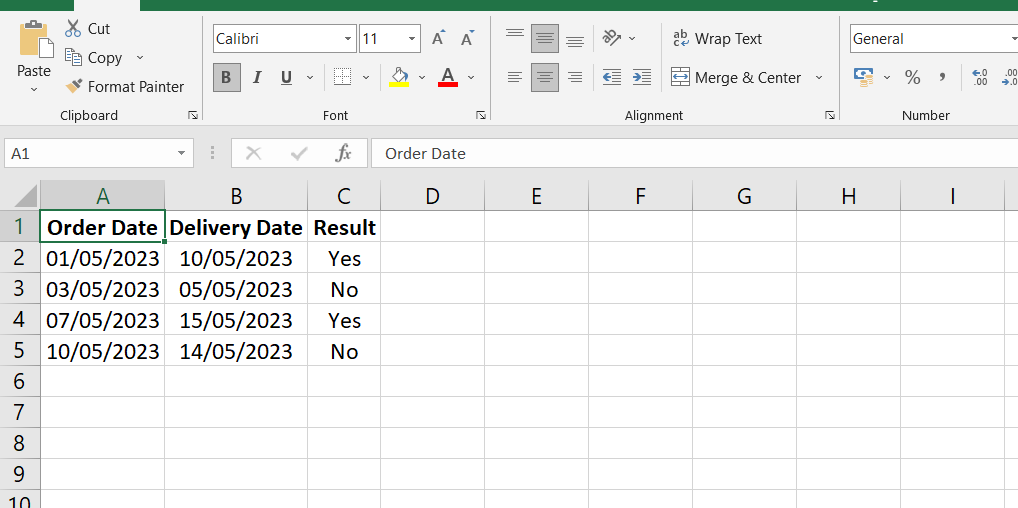
In this example, we have order dates in the "Order Date" column and delivery dates in the "Delivery Date" column. The "Result" column represents the IF function's outcome based on the delivery date being more than 7 days later than the order date.
The formula used in the "Result" column is:
=IF(D2 > 7, "Yes", "No")
For each row, the formula checks if the value in the corresponding cell of the "Delivery Date" column (e.g., D2, D3, D4, etc.) is greater than 7 days after the order date. If the condition is met, it displays "Yes" in the "Result" column; otherwise, it displays "No".
The IF function allows for many possibilities and can be nested within other functions to create even more complex logical tests and outcomes. It is a fundamental tool in Excel that enhances automation and enables customized data analysis and reporting based on specific conditions.
SUMIFS
To use the SUMIFS function, you must provide several arguments: the range of values to sum, followed by pairs of criteria range and criteria to test against.
In this example, we have sales data with the region in the "Region" column, the product in the "Product" column, and the sales amount in the "Sales Amount" column.
To calculate the total sales for a specific region entered in cell E3, we can use the SUMIFS function.
The formula used would be:
=SUMIFS(C2:C9, A2:A9, E3)
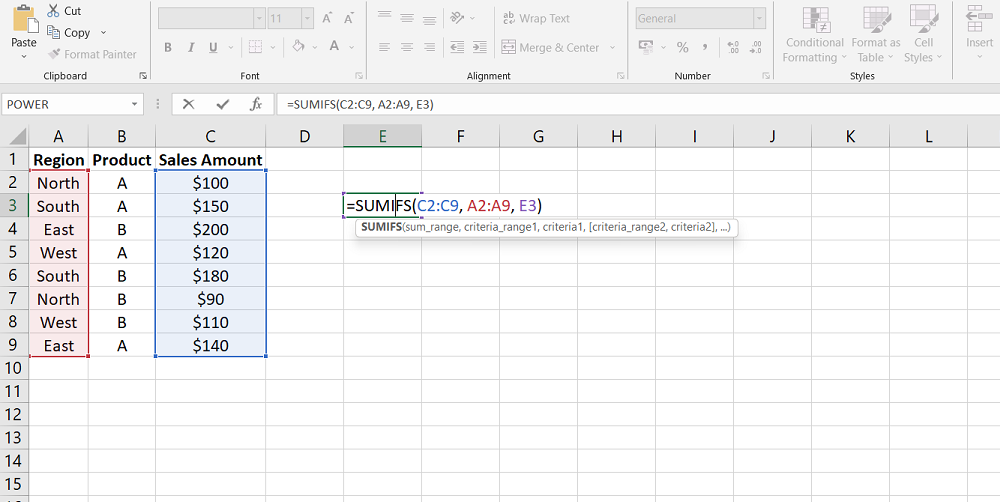
In this formula, C2:C9 represents the range of sales amounts that we want to sum. A2:A9 represents the range of regions to test against, and E3 contains the specific region we want to sum the sales for.
Based on the sales data provided in the table and assuming that "South" is entered in cell E3, the SUMIFS function will add up the sales amounts that have the corresponding region as "South". In this case, the total sales for the South region would be $330.
COUNTIFS
To use the COUNTIFS function, you provide pairs of criteria ranges and criteria to test against.
In this example, we have sales data with the region in the "Region" column, the product in the "Product" column, and the sales amount in the "Sales Amount" column.
To count the number of sales from a specific region entered in cell E3 that have a value of 200 or more, we can use the COUNTIFS function.
The formula used would be:
=COUNTIFS(B2:B9, E3, C2:C9, ">=200")
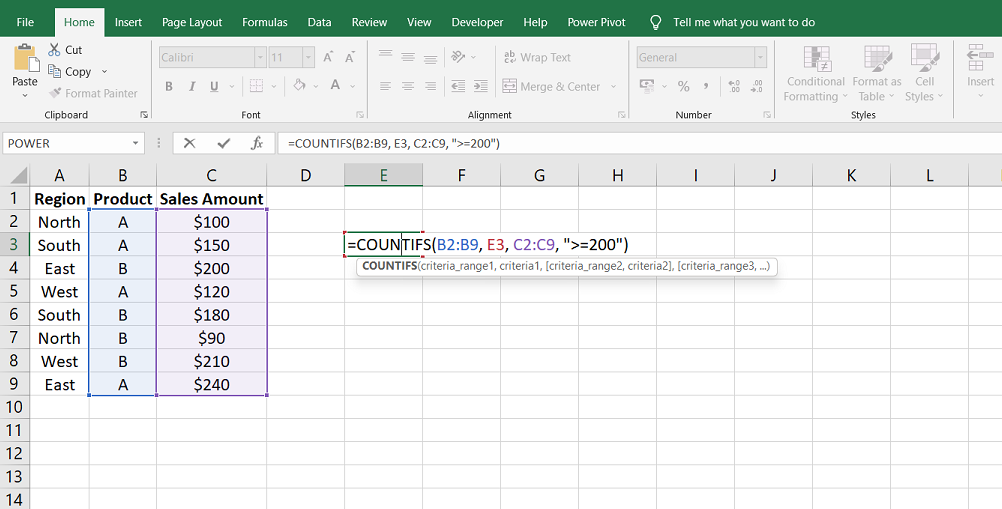
In this formula, B2:B9 represents the range of regions to test against, E3 contains the specific region we want to count the sales for, C2:C9 represents the range of sales amounts to evaluate, and ">=200" specifies the criteria for counting sales with a value of 200 or more.
Assuming that "East" is entered in cell E3, the COUNTIFS function will count the number of sales that meet the conditions of being from the "East" region and having a sales amount of 200 or more. In this case, the count of such sales would be 2.
TRIM
A common issue with trailing spaces is that they are not visible to users, causing unexpected errors or undesired results in formulas or functions. However, the TRIM function rescues by removing these hidden spaces, ensuring accurate data analysis and processing.
This example has a column labeled "Region" with the region names listed.
Let's assume there is an accidental space at the end of cell B6. This space may not be visible to the user but can cause issues using functions like COUNTIFS.

You can use the TRIM function in a separate column to clean the data and remove the trailing space. Let's say we use column C for the cleaned data.
In cell C2, you can enter the following formula:
=TRIM(B6)
This formula uses the TRIM function to remove any trailing spaces from the text in cell B2. The TRIM function ensures that the cleaned data in column C does not contain any hidden spaces.
You can then drag the formula down to apply it to the rest of the cells in column C.
CONCATENATE
To use the CONCATENATE function, you provide the text or cell references you want to combine.
In this example, we have a column labeled "First Name" and another column labeled "Last Name" where the corresponding names are listed.
We can use the CONCATENATE function to create a full name by merging the values from the "First Name" and "Last Name" columns.
Let's assume we want to combine the values from the "First Name" and "Last Name" columns and display the full name in column C.
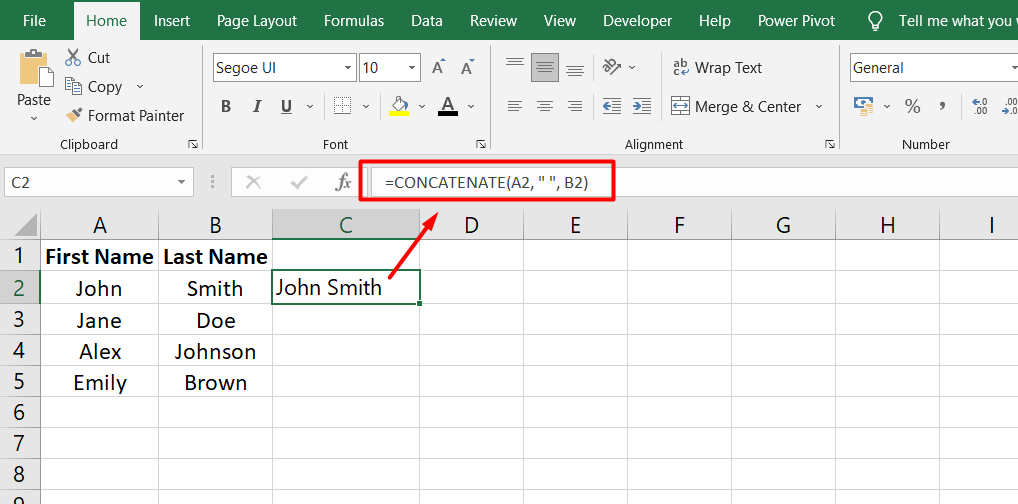
In cell C2, you can enter the following formula:
=CONCATENATE(A2, " ", B2)
This formula uses the CONCATENATE function to combine the value in cell A2 (the first name), a space (" "), and the value in cell B2 (the last name). The result is a full name.
You can then drag the formula down to apply it to the rest of the cells in column C.
LEFT/RIGHT
To use the LEFT or RIGHT function, you provide the text or cell reference from which you want to extract characters and the number of characters to extract.
In this example, we have a column labeled "Reference" where each cell contains a reference consisting of a client ID, a transaction ID, and a region code.
We can use the LEFT function to extract the client ID from the references.
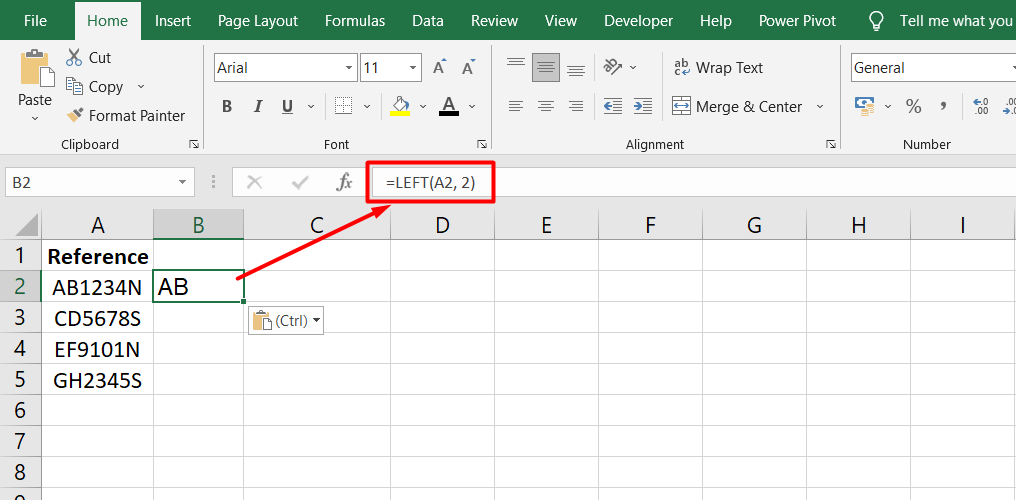
In cell B2, you can enter the following formula:
=LEFT(A2, 2)
This formula uses the LEFT function to extract the first two characters from the reference in cell A2, representing the client ID. The result will be the client ID portion.
We can use the RIGHT function to extract the region code from the references.
In cell C2, you can enter the following formula:
=RIGHT(A2, 1)
This formula uses the RIGHT function to extract the last character from the reference in cell A2, which represents the region code. The result will be the region code.
You can then drag the formulas down to apply them to the rest of the cells in columns B and C.
FAQs
Why is MS Excel important for a professional?
MS Excel is important for professionals because it allows for efficient data organization, analysis, and presentation, enabling better decision-making and increased productivity.
How do I use Excel like a professional?
To use Excel like a professional, you should focus on mastering key functions, formulas, and shortcuts, organizing data effectively, creating dynamic charts and graphs, and utilizing advanced features such as pivot tables and data validation.
What are the important uses and advantages of Microsoft Excel?
The important uses and advantages of Microsoft Excel include financial analysis, budgeting, data tracking, project management, statistical analysis, creating professional reports, and collaborating with others through shared workbooks.
What is the importance of MS Excel for students?
MS Excel is important for students as it helps them organize research data, create study schedules, analyze project data, manage budgets, and develop valuable analytical skills applicable across various fields.
What is the most important use of Excel?
The most important use of Excel is its ability to efficiently manage and analyze large sets of data, making it indispensable for tasks like data analysis, financial modeling, forecasting, and decision-making in various industries.
Final Thoughts
In conclusion, Excel offers many important features and functionalities that make it a crucial tool for professionals across various industries. Its extensive range of over 475 functions allows for complex data analysis, automation, and decision-making within spreadsheets.
Functions like IF, SUMIFS, COUNTIFS, TRIM, CONCATENATE, LEFT, and RIGHT are powerful for manipulating data, performing calculations, and extracting specific information. Excel's versatility extends beyond calculations, with features like conditional formatting, data validation, pivot tables, and charts enabling effective data visualization and reporting.
Creating macros and utilizing VBA programming further enhance Excel's automation and customization potential. With its user-friendly interface and extensive capabilities, Excel remains essential for professionals seeking efficient data management, analysis, and reporting.
One more thing
If you have a second, please share this article on your socials; someone else may benefit too.
Subscribe to our newsletter and be the first to read our future articles, reviews, and blog post right in your email inbox. We also offer deals, promotions, and updates on our products and share them via email. You won’t miss one.
Related articles
» Microsoft Excel is Attempting to Recover Your Information - How to Fix
» Mastering the Basic Parts of MS Excel for Improved Productivity
» How to Copy a Formula in Excel | Step-by-Step Guide
