Excel brings many incredibly useful and complex calculations to your everyday life by making them simple to use. One of these rather complicated formulas is the coefficient of variation. Today, you can learn how to use this formula and get interesting information about your data.

Our guide is a step-by-step, easy-to-digest article for both beginners and intermediate Excel users. We’re using the latest Microsoft Excel 2019, however, the steps should be near identical on earlier releases as well.
Need further Excel assistance? Don’t hesitate to get in touch with our experts here at SoftwareKeep. Whether you need help purchasing, activating, or using your software, we’re at your service.
What is the coefficient of variation?
In short, the coefficient of variation is a statistical measure of the distribution/dispersion of data around a mean. This is used to analyze the difference of spread in the data, all relative to the mean value.
The coefficient of variation is derived by dividing the standard deviation by the mean. As a result, you can get comparable results and compare the spread of two random variables with different units relative to the expected value.
A real-life example of how the coefficient of variation can be useful is easy to see when taking a look at investors. In portfolio analysis, the coefficient of variation is used as a quantitative measure of the risk associated with investing in an asset.
Coefficient of variation formula in Excel
The formula for the coefficient of variation in Excel is the following:
- Coefficient of Variation = (Standard Deviation / Mean)
- CV = σ / ǩ,
Tip: Multiplying the coefficient by 100 is an optional step. By doing so, you will get a percentage, as opposed to a decimal.
How to find a coefficient of variation in Excel
The steps below outline how you can use Excel to calculate the coefficient of variation. Our guide was written for the latest releases of the software, however, the steps are universal and can be performed on older versions too.
- Open Microsoft Excel and select a workbook, or create a new one. Make sure that there’s data present in your worksheet before continuing with the guide.
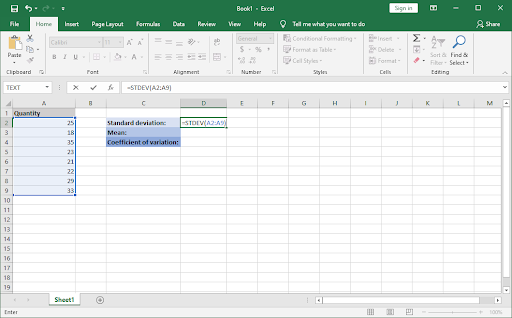
- Look for the set of data you want to use to calculate the coefficient of variation. Our example uses cells A2:A9, however, your data may be different than this.
-
First, calculate the standard deviation. Select any empty cell, and then input the following formula: =STDEV(A2:A9). Make sure to replace our example cells with the ones holding your data! Press Enter to calculate the standard deviation.

-
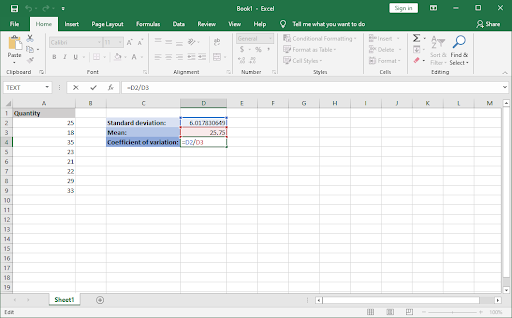
Next, calculate the mean. Select another empty cell, and input the following formula: =AVERAGE(A2:A9). Once again, replace the example cells with the correct ones holding your data.

-
Now that you have these two values, take note of their cells and select another empty cell to calculate the coefficient of variation. Input the following function: =D2/D3. Don’t forget to replace our example numbers with your own.

-
Press Enter, and you’re done! You successfully calculated the coefficient of variation using Excel’s formulas.

Final thoughts
If you need any further help with Excel, don’t hesitate to reach out to our customer service team, available 24/7 to assist you. Return to us for more informative articles all related to productivity and modern-day technology!
Would you like to receive promotions, deals, and discounts to get our products for the best price? Don’t forget to subscribe to our newsletter by entering your email address below! Receive the latest technology news in your inbox and be the first to read our tips to become more productive.