
The Excel Quick Analysis tool is a powerful feature that streamlines data analysis in Excel 2013 and later versions. With just a few simple steps, this tool enables you to effortlessly format your data into charts, tables, summary formulas, sparklines, and more.
Whether you're a beginner or an experienced user, the Quick Analysis tool provides an intuitive interface to explore various visualization options and make informed decisions with your data. In this article, we will guide you through the ins and outs of using the Excel Quick Analysis tool, empowering you to unlock its full potential and save time in your data analysis tasks.
Table of Contents
- How to create charts using the Quick Analysis tool
- Accelerate Chart Creation with Excel's Quick Analysis Tool
- Limitations of Relying Solely on Excel's Quick Analysis Tool
- Impact of Quick Analysis Tool on Excel Charting Learning Curve
- FAQs
- Final Thoughts
How to create charts using the Quick Analysis tool
To quickly create charts using the Quick Analysis tool in Excel, follow these steps:
- Select a range of cells in your Excel worksheet that you want to use for creating the chart.
-
Look for the Quick Analysis button, which appears at the bottom right corner of the selected data. Alternatively, you can press Ctrl + Q on your keyboard to access the Quick Analysis tool.

- Click on the Quick Analysis button or press Ctrl + Q to open the Quick Analysis menu.
-
From the menu options, choose "Charts." This will display a variety of chart types that you can choose from to visualize your data.
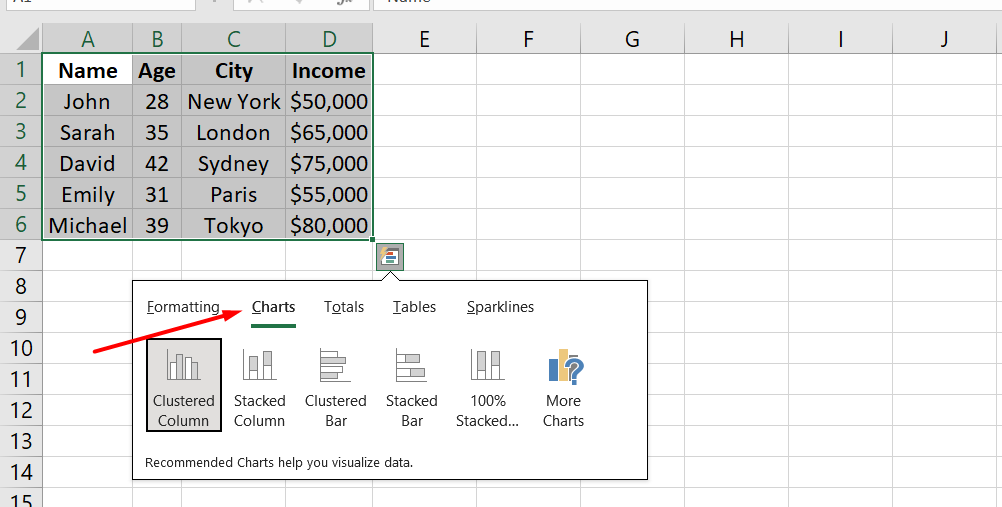
- Hover over the different chart types to preview how your data will appear in each chart style. This allows you to quickly assess which chart type suits your needs.
- Select the desired chart type by clicking on it. The chart will be automatically inserted into your worksheet.
If you want to explore more chart options, select "More" and then click on "All Charts." This will open a dialog box where you can see all the available chart types. Preview and select the chart you prefer, and then click "OK" to insert it into your worksheet.
Accelerate Chart Creation with Excel's Quick Analysis Tool
The Quick Analysis tool in Excel provides a fast and efficient way to create charts based on your data. Here's how it assists you in quickly generating charts:
- Simplified chart creation: The Quick Analysis tool eliminates the need for manual chart setup and formatting by offering a streamlined process specifically designed for quick chart creation.
- Instant preview: It allows you to hover over different chart types to see a live preview of how your data will look in each chart. This enables you to make an informed decision about the most suitable chart type for your data.
- Wide range of chart options: The Quick Analysis tool offers a variety of chart types, including column, bar, line, pie, scatter, and more. This ensures that you can find the perfect chart style to effectively represent your data.
- Access to all available charts: If the initial chart options don't meet your requirements, you can choose the "More" option to explore a comprehensive library of all available chart types in Excel. This gives you even more flexibility and customization options.
- Automatic insertion: Once you've selected the desired chart type, the Quick Analysis tool automatically inserts the chart into your worksheet. This saves you time and effort compared to manually creating and positioning the chart.
Limitations of Relying Solely on Excel's Quick Analysis Tool
When relying solely on the Quick Analysis tool for chart creation in Excel, users may encounter some potential limitations and challenges to be aware of:
- Limited customization options: While the Quick Analysis tool offers a range of chart types, the level of customization available may be more limited compared to manually creating charts. Users may have less control over specific formatting details or advanced chart elements.
- Inadequate data manipulation: The Quick Analysis tool primarily focuses on chart creation and may not provide extensive data manipulation capabilities. Users may need to perform additional data transformations or calculations before using the tool for more complex charting needs.
- Lack of specialized chart types: Depending on the specific requirements, users may find that the Quick Analysis tool does not include certain specialized chart types or advanced visualizations that are available through manual chart creation or dedicated add-ins.
- Compatibility limitations: The Quick Analysis tool may have compatibility limitations with older versions of Excel or different operating systems. Users should ensure that they are using a compatible version of Excel to access the tool's full functionality.
- Limited control over chart layout: Users may face challenges in adjusting the layout or positioning of the chart within the worksheet. Fine-tuning the placement or alignment of the chart elements may require additional manual adjustments.
Impact of Quick Analysis Tool on Excel Charting Learning Curve
The Quick Analysis tool in Excel may impact the learning curve for individuals who seek a deeper understanding of chart creation and formatting techniques in the following ways:
- Dependency on automation: Relying solely on the Quick Analysis tool may hinder users from developing a comprehensive understanding of the underlying principles and techniques involved in chart creation. The automated nature of the tool reduces the need for manual intervention, potentially limiting the learning experience.
- Limited exposure to advanced features: The Quick Analysis tool simplifies the chart creation process, but it may not expose users to advanced features and functionalities available in Excel. This could prevent individuals from exploring more complex charting techniques and customizations.
- Reduced familiarity with chart formatting options: Since the Quick Analysis tool handles much of the formatting automatically, users may have less exposure to the full range of formatting options available in Excel. This can restrict their ability to fine-tune and customize charts to meet specific requirements.
- Less understanding of troubleshooting and problem-solving: By relying solely on the Quick Analysis tool, individuals may miss out on opportunities to troubleshoot and solve chart-related issues manually. This can hinder their problem-solving skills and prevent them from gaining a deeper understanding of charting concepts.
- Limited transferable knowledge: The skills acquired through the Quick Analysis tool may not easily translate to other charting tools or software. This may restrict users' ability to adapt to different platforms or explore alternative data visualization tools beyond Excel.
FAQs
How do you use the quick analysis tool to apply the data bars?
To apply data bars using the Quick Analysis tool in Excel, select the cell range containing your data, click on the Quick Analysis button that appears in the lower-right corner of the selection, and choose the "Data Bars" option from the formatting options that appear.
How to use the quick analysis tool to insert a column sparkline?
To insert a column sparkline using the Quick Analysis tool, select the cell range where you want the sparkline to appear, click on the Quick Analysis button, choose the "Sparklines" option, and then select "Column" from the sparkline types available.
How do I use data tool in Excel?
The data tools in Excel offer various functionalities for data analysis. You can access them through the "Data" tab on the Excel ribbon, and they include features like sorting, filtering, pivot tables, data validation, and more, allowing you to manipulate and analyze your data efficiently.
What is the use of Excel tool?
Excel is a versatile tool that allows users to perform a wide range of tasks such as data entry, calculation, data analysis, visualization, and reporting. It is commonly used for organizing and analyzing data, creating charts and graphs, performing complex calculations, and automating repetitive tasks.
How is Excel used to analyze data? What tools help in the analysis?
Excel is commonly used to analyze data by utilizing various built-in tools such as pivot tables, data filters, sorting, formulas and functions, conditional formatting, and charts/graphs. These tools assist in data manipulation, summarization, visualization, and extracting insights from the data, enabling users to perform comprehensive data analysis.
Final Thoughts
In conclusion, the Excel Quick Analysis tool is a valuable feature that simplifies data analysis and chart creation in Excel. It offers a user-friendly interface and a wide range of options for formatting data into charts, tables, sparklines, and more.
By utilizing this tool, users can save time and effort in the data analysis process, allowing them to focus on deriving insights and making informed decisions. It is particularly beneficial for beginners and those who are unsure about where to start with data visualization.
One more thing
If you have a second, please share this article on your socials; someone else may benefit too.
Subscribe to our newsletter and be the first to read our future articles, reviews, and blog post right in your email inbox. We also offer deals, promotions, and updates on our products and share them via email. You won’t miss one.