We can only wish that data was always 100% accurate and perfect. However, in most cases, this isn’t true. Even if you collect data to your best effort, there’s always room for error. To account for this, Excel allows you to add margins of error and standard deviations.

If your work in the field can benefit from reflecting on margins of error, you need to learn this useful technique. In this article, we’ll be going over how you can add a standard deviation bar to accurately represent your data in a chart or graph, accounting for any possible errors.
Add a Standard Deviation bar in Excel for Windows
The steps below describe how you can add a Standard Deviation bar to your charts and graphs in Excel for the Windows operating system. Please note that the following procedure was written for users working with Office 2013 or newer products. Looking for steps in older versions? Jump to Add a Standard Deviation bar in Excel 2007-2010.
- Open the spreadsheet containing your data and chart. If you don’t have one yet, start a new spreadsheet and input your data, then create your desired chart before proceeding.
- Select your chart by clicking on it once.
-
Click on the Chart Elements button next to the chart represented by a + sign, then check the Error Bars box. In the future, if you wish to remove error bars, simply clear the box.
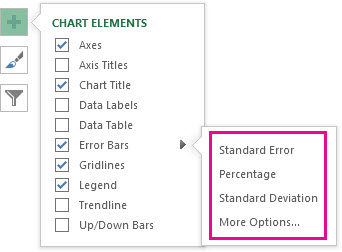
(Image source: Microsoft) - Click on the arrow next to Error Bars, and choose Standard Deviation.
- If you wish to set your own amounts, click on the More Options button and choose the options you want. Note that the direction of the error bars depends on what type of shart you’re using.
Add a Standard Deviation bar in Excel 2007-2010
Standard Deviation bars function the same in dated versions of Excel, however, their location was changed in Office 2013. To add this error bar in your spreadsheets using an older release, follow the steps below.
- Open the spreadsheet containing your data and chart. If you don’t have one yet, start a new spreadsheet and input your data, then create your desired chart before proceeding.
- Select your chart by clicking on it once.
-
The Layout tab should show up in your Ribbon header. Here, find the Error Bars dropdown menu and click on it once.
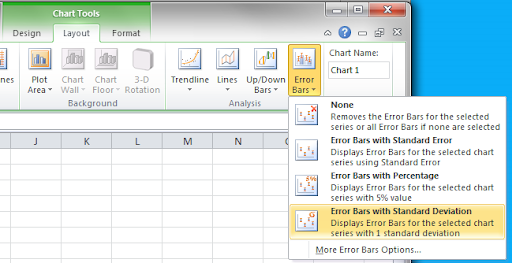
(Image source: Pryor) - Click on Error Bars with Standard Deviation.
Add a Standard Deviation bar in Excel for Mac
The steps below describe how you can add a Standard Deviation bar to your charts and graphs in Excel for Mac. Please note that the following procedure was written for users working with Office 2013 or newer products. In older versions, some steps may vary.
- Open the spreadsheet containing your data and chart. If you don’t have one yet, start a new spreadsheet and input your data, then create your desired chart before proceeding.
- Select your chart by clicking on it once.
-
Switch to the Chart Design tab in the Ribbon header.
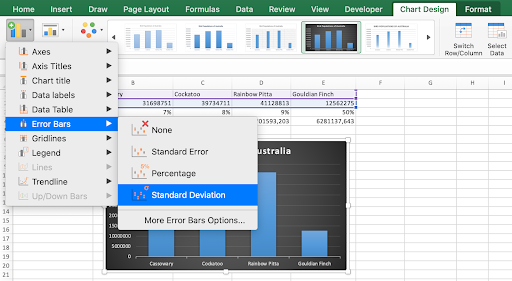
- Click on the Add Chart Element drop-down menu, located in the far left of the Ribbon.
- Hover your mouse cursor over Error Bars, then select Standard Deviation.
Final thoughts
If you need any further help, don’t be afraid to reach out to our customer service team, available 24/7 to assist you. Return to us for more informative articles all related to productivity and modern day technology!
Would you like to receive promotions, deals, and discounts to get our products for the best price? Don’t forget to subscribe to our newsletter by entering your email address below! Receive the latest technology news in your inbox and be the first to read our tips to become more productive.