
In this article, we'll guide you through creating reports in Excel, highlighting various methods based on your specific needs. Whether you're a beginner or an experienced user, this comprehensive guide will equip you with the necessary skills to streamline your data analysis and make informed business decisions.
Table of Contents
- How to make reports in Excel
- Display data in charts
- Create a pivot table to organize data
- Separate the data types of your reports
- Add page headers
- Format and print reports
- What are Excel reports used for?
- FAQs
- Final Thoughts
How to make reports in Excel
When it comes to making reports in Excel, there are multiple methods you can utilize. In the following steps, we will explore some approaches you can take to create effective reports using Microsoft Excel.
Display data in charts
One approach to creating reports in Excel is by displaying your data in charts or graphs. Excel provides various chart types that you can use to visually represent your data, such as line graphs, pie charts, and tables.
Follow these steps to create a visual report using graphs:
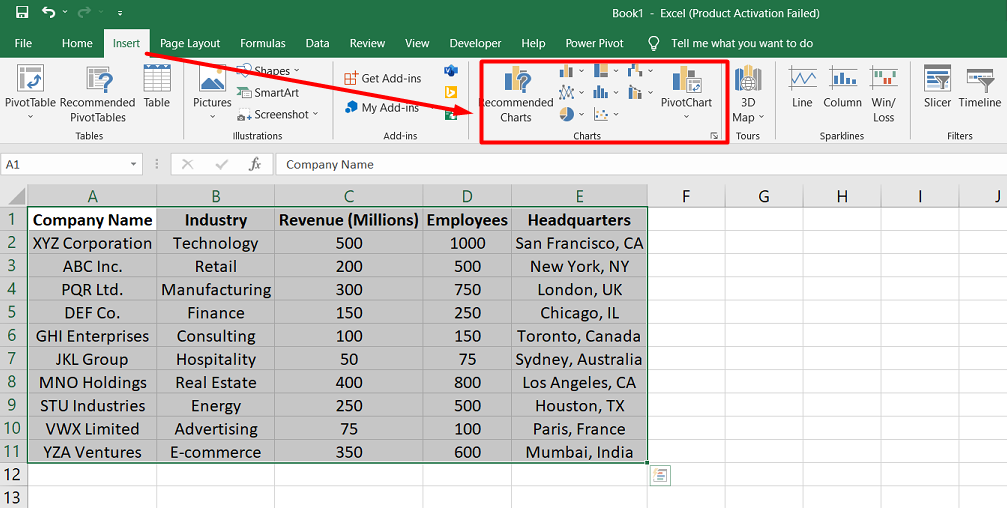
- Enter your data into the Excel spreadsheet using the "Insert" option in the program toolbar.
- Once your data is entered, select the range you want to include in your chart.
-
Click the "Insert" tab and choose the desired chart type from the available options.
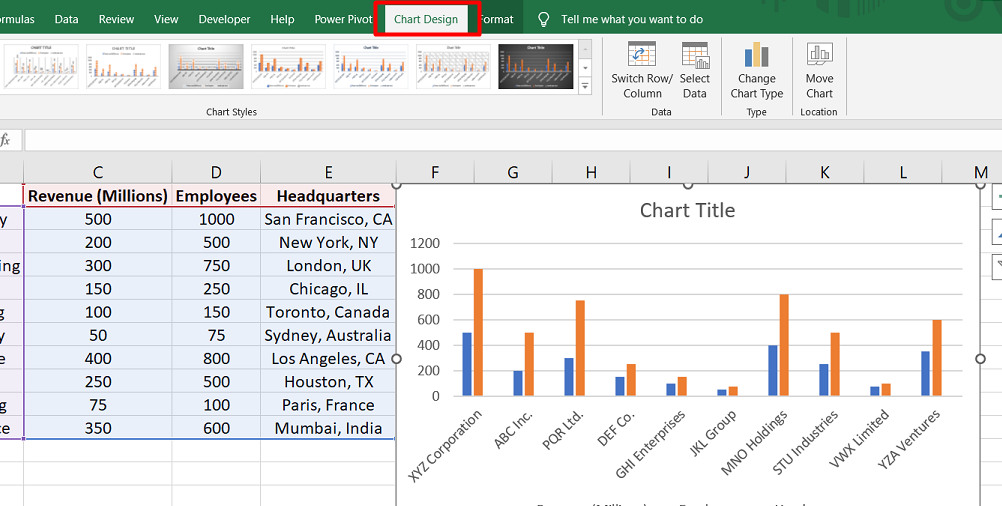
- Excel will generate a basic chart based on the selected data. You can customize the chart by adding titles, axes labels, and legends.
-
To change the chart design, navigate to the "Chart Design" tab in the menu. Here, you can choose from various pre-defined chart styles or customize elements like colors, fonts, and layouts.
- Update the chart as needed by adding or modifying data in the underlying spreadsheet. The chart will automatically reflect the changes.
Create a pivot table to organize data
You can utilize pivot tables to organize large data sets and create informational reports in Excel. A pivot table summarizes data and allows you to extract key insights easily.
Follow these steps to create a report using pivot tables:
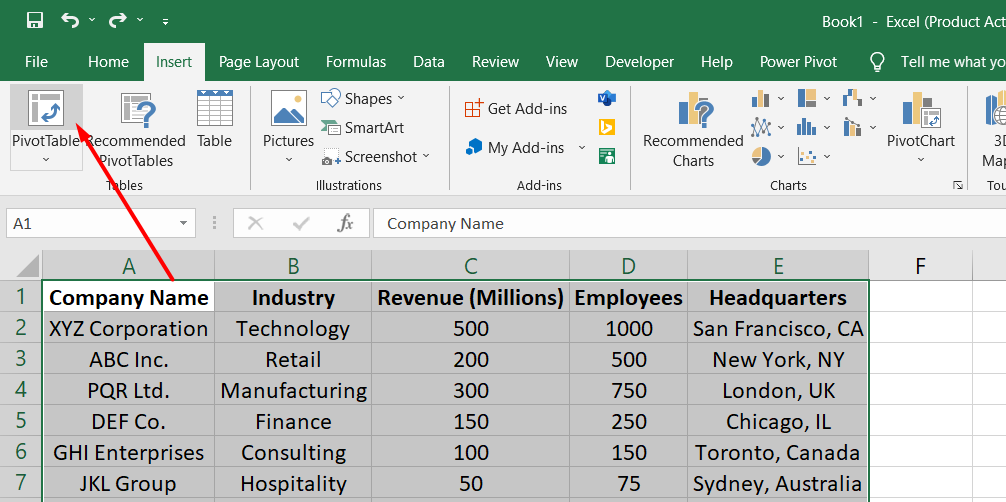
-
Go to the "Insert" option in Excel and select "PivotTable" from the menu. A dialog box will appear.
-
Choose the range of data you want to include in the pivot table. This can be a single worksheet or a range across multiple sheets.
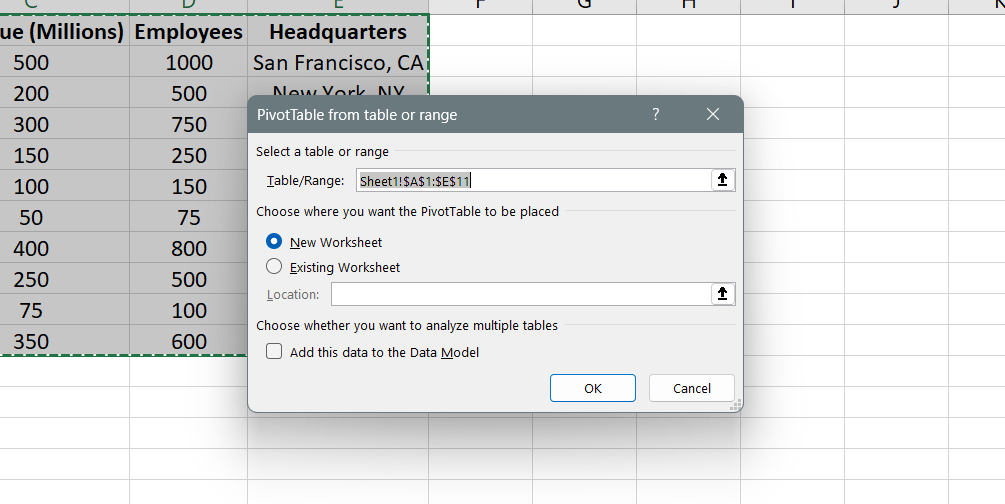
- Specify the location where you want to place the pivot table. You can either choose a new worksheet or an existing one.
-
In the pivot table, arrange the fields by dragging them to the desired areas. The "Rows" area contains the row labels, the "Columns" area contains the column labels, and the "Values" area displays the summarized values.
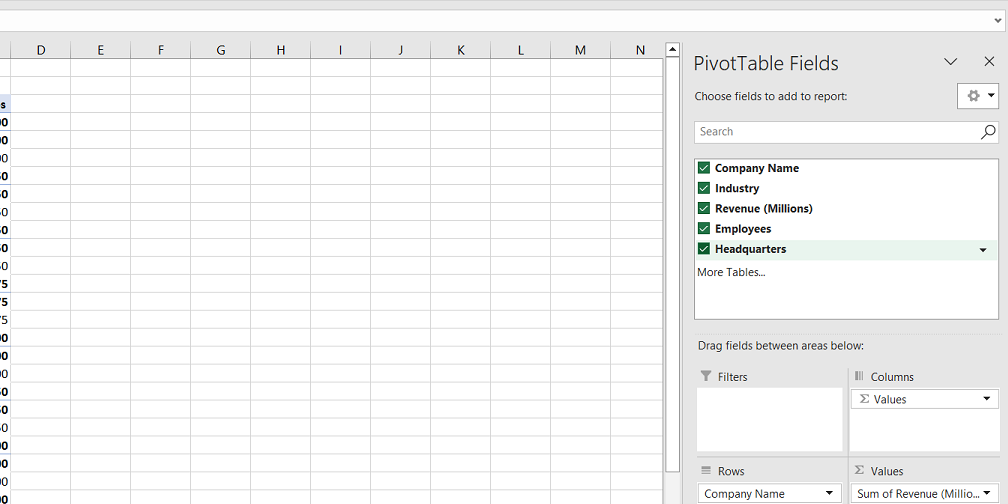
- Enter the labels for the reference and values fields in the pivot table. This helps in organizing and categorizing the data accurately.
- Choose the calculation you want the pivot table to perform on the data. This can include sum, average, maximum, minimum, count, etc.
- Updating the data connected to the pivot table automatically refreshes and reflects the changes in the report, allowing you to analyze the data from different angles.
Separate the data types of your reports
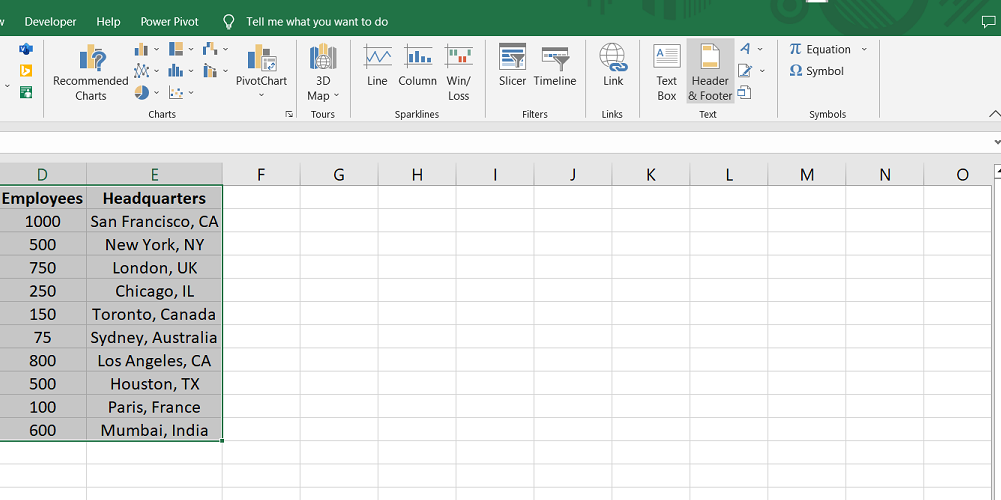
With large datasets, consider categorizing numerical data values, visual elements, and text information into separate sheets or tabs within the workbook. Here's how you can accomplish this:
- Excel allows you to create multiple sheets within a workbook. Each sheet can be dedicated to a specific type of data or content in your report.
- Determine your different data types, such as numerical data, charts/graphs, and text information.
- Create a new sheet for each data type by right-clicking on the sheet name at the bottom of the Excel window and selecting "Insert" or using the "+" button.
- Name each sheet accordingly to reflect the data it contains. For example, you can have a "Data" sheet for numerical data, a "Charts" sheet for visual representations, and a "Text" sheet for any textual information.
- Move or copy the relevant data and content from the original sheet to the respective sheets you created.
- Customize each sheet according to the specific data type. For example, you can create charts and graphs on the "Charts" sheet, apply appropriate formatting and formulas to the "Data" sheet, and enter textual information on the "Text" sheet.
Add page headers
Page headers provide essential information and branding at the top of each page. Here's how you can insert page headers in your Excel reports:
- Go to the menu and select "Insert."
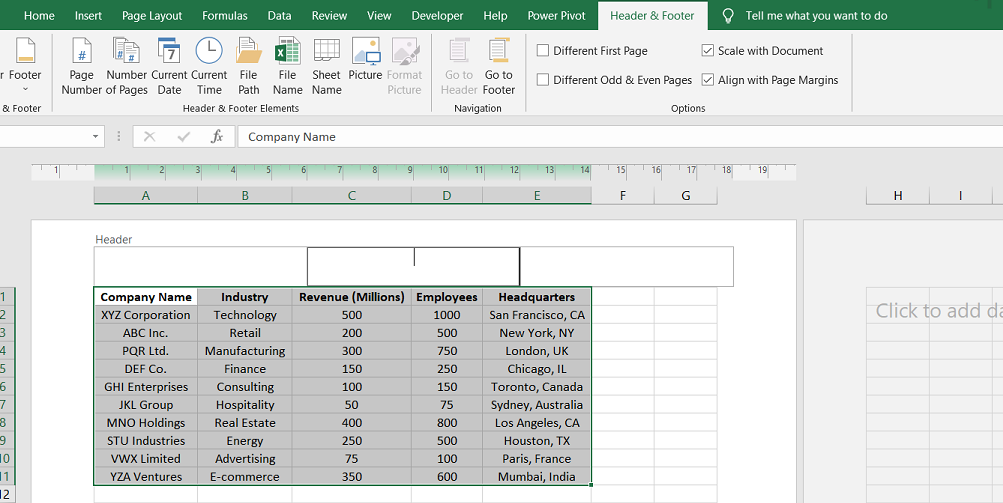
-
Choose "Text" from the options and click "Header and Footer."
-
In the header section, enter the name or title of your report. You can format the text by selecting it and using options like font size, font style, or bold formatting.
- Repeat this process for each page you want to include in the printed report. Excel will automatically add the header to every page.
- To exclude specific sheets from your report, right-click on the corresponding tabs at the bottom of the Excel window and select "Hide." This ensures that those hidden sheets will not be included when printing or exporting the report.
Format and print reports
When it comes to formatting and printing reports in Excel, there are a few steps you can follow to optimize the layout and ensure that your report fits well on the printed pages:
-
For reports containing visual data such as graphs, charts, or pivot tables, consider changing the page orientation to "Landscape" under the print settings. This allows for a wider view and better utilization of space.
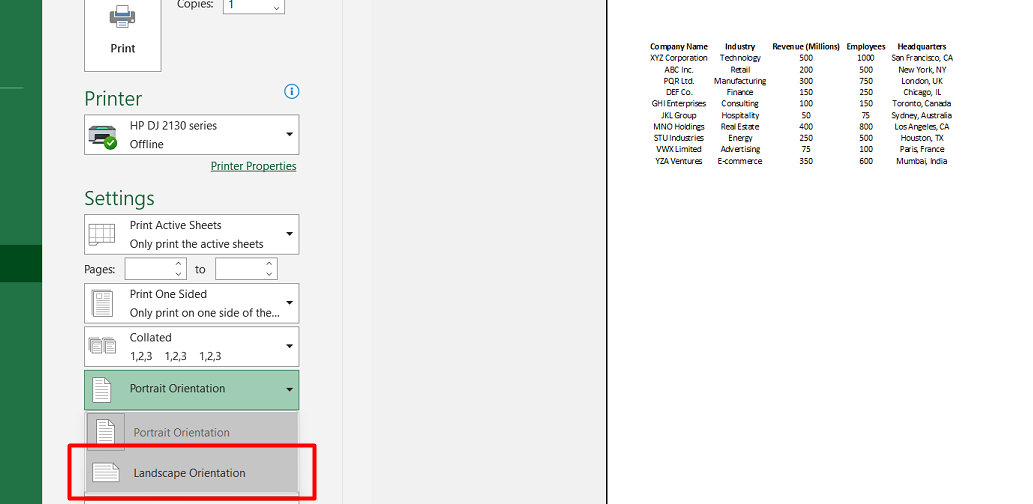
- To fit all the columns of your report on a single page, select the option that allows you to scale the content to fit the page width. This ensures that the entire report is visible without horizontal scrolling.
- After adjusting the print settings, click "OK" to print the workbook. This will generate individual pages for each sheet within your report's workbook.
- If you intend to send the reports via email or share them digitally, saving the document as a .pdf file is recommended. This ensures compatibility and maintains the formatting and layout of the report when viewed on different devices or platforms.
What are Excel reports used for?
Excel reports have diverse applications across various fields and industries. Here are some common uses of Excel reports:
- Finance and Accounting: Excel reports are widely used in financial analysis and reporting. Professionals in finance and accounting can utilize Excel's features to track and analyze financial data, such as budgets, incomes, expenses, and financial ratios.
- Reports help in presenting this data in a structured and visually appealing manner.
-
Sales and Marketing: Excel reports are crucial in sales and marketing activities. Sales teams can create reports to track sales performance, monitor customer behavior, analyze conversion rates, and manage inventories.
In marketing, Excel reports are used for campaign progress tracking, budget analysis, market research, and evaluating the effectiveness of marketing strategies. -
Human Resources: Excel reports are valuable in human resources for various purposes. They can be used to document and track hiring processes, including application numbers, interview invitations, and successful hires.
Reports also help in measuring employee growth rates, tracking training programs, and monitoring HR metrics like employee turnover and performance evaluations.
FAQs
How do I create a report and form in Excel?
To create a report and form in Excel, you can use features like tables, pivot tables, and data validation to structure and organize your data effectively.
What is report format in Excel?
Report format in Excel refers to the arrangement and design of data, including headers, columns, rows, and formatting options such as colors, fonts, and borders, that make the report visually appealing and easy to understand.
How do I create a student report in Excel?
To create a student report in Excel, you can set up a template with relevant headings, such as student names, grades, attendance, and other relevant information, and enter the data accordingly.
How do I create a Word report from Excel data?
To create a Word report from Excel data, you can use the "Mail Merge" feature in Word, linking it to your Excel data source to automatically populate the report with the desired information.
What kind of reports can you make in Excel?
Excel offers various report types, including financial reports, sales reports, inventory reports, project status reports, budget reports, and more. With its versatile features and functions, Excel can be customized to suit various reporting needs.
Final Thoughts
Creating reports in Microsoft Excel can be a powerful way to organize and present data effectively. By leveraging the various features and tools available, you can create visually appealing and insightful reports for different purposes.
Excel offers flexibility in report creation, whether you choose to display data in charts and graphs, utilize pivot tables for data aggregation, or separate data types into different sheets. Additionally, incorporating page headers and formatting options helps prepare reports for printing or exporting.
Excel reports find applications in finance, sales, marketing, human resources, and other fields where data analysis and presentation are essential.
One more thing
If you have a second, please share this article on your socials; someone else may benefit too.
Subscribe to our newsletter and be the first to read our future articles, reviews, and blog post right in your email inbox. We also offer deals, promotions, and updates on our products and share them via email. You won’t miss one.
Related articles
» Unable to Add or Create New Cells in Excel
» Create Word Clouds Excel: Step-by-Step Tutorial
» Beginner's Guide to Microsoft Excel Online: Manage Data & Create Spreadsheets