As data analytics evolves, the range of available data analysis tools grows with it. Excel is easily available, most applicable, and easy to use for both basic and advanced data analysis. But there are more data analysis tools to consider if you’re considering a career in the field.
So, we made a list and highlighted some key data analytics tools you need to know and why. The tools in this post can be free, like Microsoft Excel, open source, or AI-supported.
Let’s dive in.
13 Best Data Analytics Software
Here is the list of our selected data analysis tools we’ll cover:
- Truly Sheets
- Microsoft Excel
- Python
- R
- SQL
- Jupyter Notebook
- Apache Spark
- Google Cloud AutoML
- SAS
- Microsoft Power BI
- Tableau
- KNIME
- Steamlit
Let's look at them closely to see what they have to offer.
1. Truly Sheets
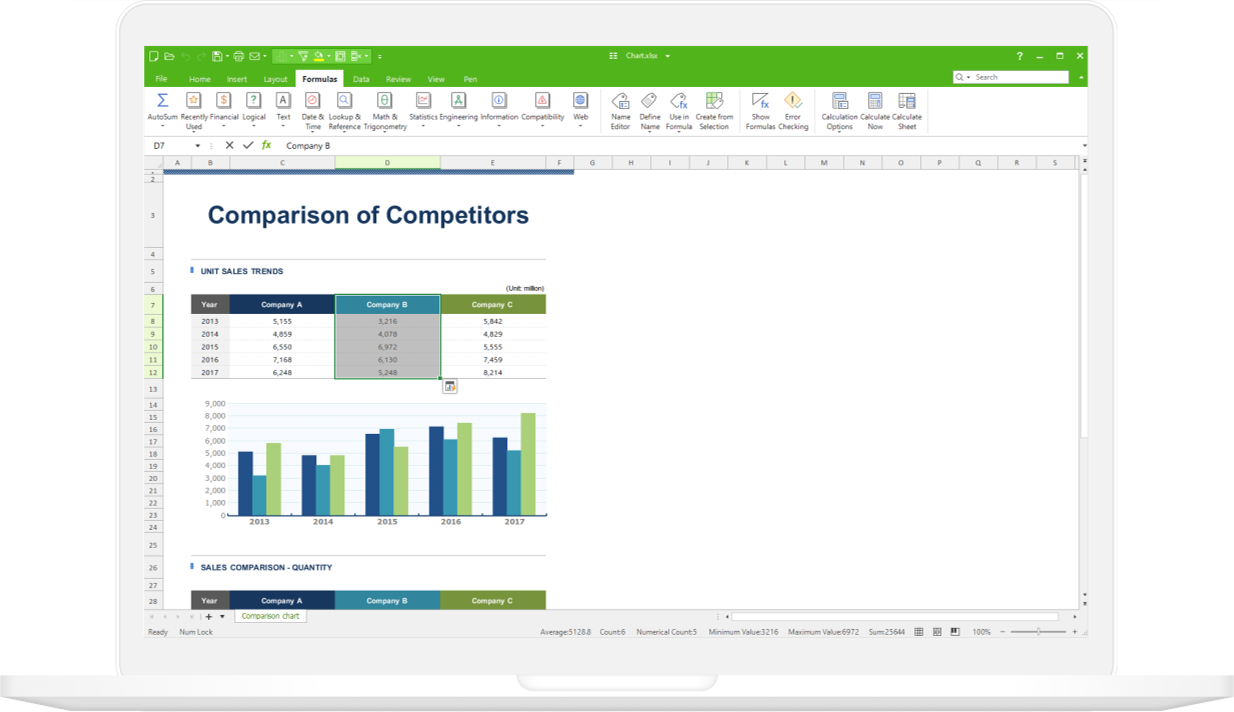
You’ve not tried a truly great data analysis tool if you’ve not used Truly Sheets. Discover the Truly difference to simplify complex data while safeguarding your information. Truly Sheets is a productivity app part of the Truly Office Suite.
460+ functions plus enhanced privacy
- Type of tool: spreadsheet software.
- Availability: Commercial (Part of Truly Office Suite)
- Use for: Data analysis and reporting
- Pros: Widely available, enhanced data privacy, Compatible with all Office/Google docs formats, 460+ functions
- Cons: None recorded so far.
With Truly Sheets, you’ll explore your data freely with advanced pivot tables designed to keep your data yours. Unlock instant, intuitive insights using our Rapid Function. In addition, filtering and sorting have also been made simple and safe. You’ll get precisely what you need using Truly Sheets’ enhanced filter function to help you manage extensive data sets easily and securely with our intuitive sorting capabilities.
Whatever you’re using the app for, you get guaranteed visual brilliance and privacy assurance. Transform your numbers into captivating visuals. Leverage charts and sparklines to beautify your data while ensuring it stays confidential.
And, complex data is handled smoothly and safely. Operate complicated charts and demanding formulas effortlessly. Enjoy quick opening, editing, and saving capabilities, all while keeping your data under lock and key.
2. Microsoft Excel
Excel at a glance:
- Type of tool: Spreadsheet software.
- Availability: Commercial.
- Mostly used for: Data wrangling and reporting.
- Pros: Widely used, with lots of useful functions and plug-ins.
- Cons: Cost, calculation errors, poor at handling big data.
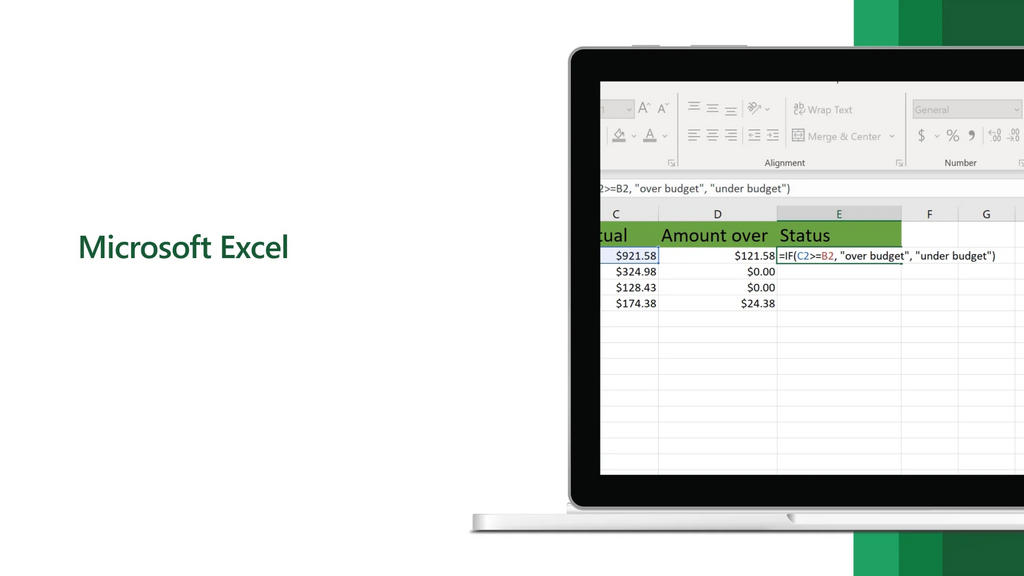
Excel is widely used spreadsheet software that is part of Microsoft Office. It features calculations and graphing functions ideal for data analysis.
Whatever your specialism, and no matter what other software you might need, Excel is a staple in the field. Its invaluable built-in features include pivot tables (for sorting or totaling data) and form-creation tools.
It also has a variety of other functions that streamline data manipulation. For instance, the CONCATENATE function allows you to combine text, numbers, and dates into a single cell. SUMIF lets you create value totals based on variable criteria, and Excel’s search function makes it easy to isolate specific data.
It has limitations, though. For instance, it runs very slowly with big datasets and tends to approximate large numbers, leading to inaccuracies. Nevertheless, it’s an important and powerful data analysis tool, and with many plug-ins available, you can easily bypass Excel’s shortcomings. Get started with these ten Excel formulas that all data analysts should know.
3. Python
Python at a glance:
- Type of tool: Programming language.
- Availability: Open-source, with thousands of free libraries.
- Used for: Everything from data scraping to analysis and reporting.
- Pros: Easy to learn, highly versatile, widely-used.
- Cons: Memory intensive—doesn’t execute as fast as some other languages.
A programming language with a wide range of uses, Python is a must-have for any data analyst. Unlike more complex languages, it focuses on readability, and its general popularity in the tech field means many programmers are already familiar with it.
Python is also extremely versatile; it has a huge range of resource libraries suited to a variety of different data analytics tasks. For example, the NumPy and pandas libraries are great for streamlining highly computational tasks, as well as supporting general data manipulation.
Libraries like Beautiful Soup and Scrapy are used to scrape data from the web, while Matplotlib is excellent for data visualization and reporting. Python’s main drawback is its speed—it is memory intensive and slower than many languages. In general though, if you’re building software from scratch, Python’s benefits far outweigh its drawbacks.
4. Azure SQL Database
Azure SQL Database is a fully managed relational database platform as a service (PaaS) built for the cloud to provide enterprise-grade data models in the cloud. It offers high availability, scalability, and security features. Azure SQL Database handles tasks such as patching, backups, and monitoring automatically. With Azure, you can use advanced mashup and modeling features to combine data from multiple data sources, define metrics, and secure your data in a single, trusted tabular semantic data model. The data model provides an easier and faster way for users to analyze ad hoc data using tools like Power BI and Excel.
Key features:
- Fully Managed Service and high availability
- Scalability and hypescale
- Azure data platform connection
- Security and governance with built-in security and compliance
- Data API builder
- Intelligent Performance - intelligent query processing
- Advanced Analytics
- Global Reach
- Compatibility
Azure Analysis Services is available in Developer, Basic, and Standard tiers. Within each tier, plan costs vary according to processing power, Query Processing Units (QPUs), and memory size. When you create a server, you select a plan within a tier. You can change plans up or down within the same tier, or upgrade to a higher tier, but you can't downgrade from a higher tier to a lower tier.
5. R

R at a glance:
- Type of tool: Programming language.
- Availability: Open-source.
- Mostly used for: Statistical analysis and data mining.
- Pros: Platform independent, highly compatible, lots of packages.
- Cons: Slower, less secure, and more complex to learn than Python.
R, like Python, is a popular open-source programming language. It is commonly used to create statistical/data analysis software.
R’s syntax is more complex than Python and the learning curve is steeper. However, it was built specifically to deal with heavy statistical computing tasks and is very popular for data visualization. A bit like Python, R also has a network of freely available code, called CRAN (the Comprehensive R Archive Network), which offers 10,000+ packages.
It integrates well with other languages and systems (including big data software) and can call on code from languages like C, C++, and FORTRAN. On the downside, it has poor memory management, and while there is a good community of users to call on for help, R has no dedicated support team. But there is an excellent R-specific integrated development environment (IDE) called RStudio, which is always a bonus!
6. Jupyter Notebook
Jupyter Notebook at a glance:
- Type of tool: Interactive authoring software.
- Availability: Open-source.
- Mostly used for: Sharing code, creating tutorials, presenting work.
- Pros: Great for showcasing, language-independent.
- Cons: Not self-contained, nor great for collaboration.
Jupyter Notebook is an open-source web application that allows you to create interactive documents. These combine live code, equations, visualizations, and narrative text.
Imagine something a bit like a Microsoft word document, only far more interactive, and designed specifically for data analytics! As a data analytics tool, it’s great for showcasing work: Jupyter Notebook runs in the browser and supports over 40 languages, including Python and R.
It also integrates with big data analysis tools, like Apache Spark (see below) and offers various outputs from HTML to images, videos, and more.
But as with every tool, it has its limitations. Jupyter Notebook documents have poor version control, and tracking changes is not intuitive. This means it’s not the best place for development and analytics work (you should use a dedicated IDE for these) and it isn’t well suited to collaboration.
Since it isn’t self-contained, this also means you have to provide any extra assets (e.g. libraries or runtime systems) to anybody you’re sharing the document with. But for presentation and tutorial purposes, it remains an invaluable data science and data analytics tool.
7. Apache Spark
Apache Spark at a glance:
- Type of tool: Data processing framework
- Availability: Open-source
- Mostly used for: Big data processing, machine learning
- Pros: Fast, dynamic, easy to use
- Cons: No file management system, rigid user interface
Apache Spark is a software framework that allows data analysts and data scientists to process vast data sets quickly. It was first developed in 2012, it’s designed to analyze unstructured big data, Spark distributes computationally heavy analytics tasks across many computers.
While other similar frameworks exist (for example, Apache Hadoop) Spark is exceptionally fast. By using RAM rather than local memory, it is around 100x faster than Hadoop. That’s why it’s often used for the development of data-heavy machine learning models.
It even has a library of machine learning algorithms, MLlib, including classification, regression, and clustering algorithms. On the downside, consuming so much memory means Spark is computationally expensive. It also lacks a file management system, so it usually needs integration with other software, e.g., Hadoop.
8. Google Cloud AutoML
Google Cloud AutoML at a glance:
- Type of tool: Machine learning platform
- Availability: Cloud-based, commercial
- Mostly used for: Automating machine learning tasks
- Pros: Allows analysts with limited coding experience to build and deploy ML models, skipping lots of steps
- Cons: Can be pricey for large-scale projects, lacks some flexibility
A serious proposition for data analysts and scientists in 2024 is Google Cloud’s AutoML tool. With the hype around generative AI in 2023 set to roll over into the next year, tools like AutoML but the capability to create machine learning models into your own hands.
Google Cloud AutoML contains a suite of tools across categories from structured data to language translation, image and video classification. As more and more organizations adopt machine learning, there will be a growing demand for data analysts who can use AutoML tools to automate their work easily.
9. SAS
SAS at a glance:
- Type of tool: Statistical software suite
- Availability: Commercial
- Mostly used for: Business intelligence, multivariate, and predictive analysis
- Pros: Easily accessible, business-focused, good user support
- Cons: High cost, poor graphical representation
SAS (which stands for Statistical Analysis System) is a popular commercial suite of business intelligence and data analysis tools. It was developed by the SAS Institute in the 1960s and has evolved ever since. Its main use today is for profiling customers, reporting, data mining, and predictive modeling. Created for an enterprise market, the software is generally more robust, versatile, and easier for large organizations to use. This is because they tend to have varying levels of in-house programming expertise.
But as a commercial product, SAS comes with a hefty price tag. Nevertheless, with cost comes benefits; it regularly has new modules added, based on customer demand. Although it has fewer of these than say, Python libraries, they are highly focused. For instance, it offers modules for specific uses such as anti-money laundering and analytics for the Internet of Things.
10. Microsoft Power BI
Power BI at a glance:
- Type of tool: Business analytics suite.
- Availability: Commercial software (with a free version available).
- Mostly used for: Everything from data visualization to predictive analytics.
- Pros: Great data connectivity, regular updates, good visualizations.
- Cons: Clunky user interface, rigid formulas, data limits (in the free version).
At less than a decade old, Power BI is a relative newcomer to the market of data analytics tools. It began life as an Excel plug-in but was redeveloped in the early 2010s as a standalone suite of business data analysis tools. Power BI allows users to create interactive visual reports and dashboards, with a minimal learning curve. Its main selling point is its great data connectivity—it operates seamlessly with Excel (as you’d expect, being a Microsoft product) but also text files, SQL server, and cloud sources, like Google and Facebook analytics.
It also offers strong data visualization but has room for improvement in other areas. For example, it has quite a bulky user interface, rigid formulas, and the proprietary language (Data Analytics Expressions, or ‘DAX’) is not that user-friendly. It does offer several subscriptions though, including a free one. This is great if you want to get to grips with the tool, although the free version does have drawbacks—the main limitation being the low data limit (around 2GB).
11. Tableau
Tableau at a glance:
- Type of tool: Data visualization tool.
- Availability: Commercial.
- Mostly used for: Creating data dashboards and worksheets.
- Pros: Great visualizations, speed, interactivity, mobile support.
- Cons: Poor version control, no data pre-processing.
If you’re looking to create interactive visualizations and dashboards without extensive coding expertise, Tableau is one of the best commercial data analysis tools available. The suite handles large amounts of data better than many other BI tools, and it is very simple to use. It has a visual drag and drop interface (another definite advantage over many other data analysis tools). However, because it has no scripting layer, there’s a limit to what Tableau can do. For instance, it’s not great for pre-processing data or building more complex calculations.
While it does contain functions for manipulating data, these aren’t great. As a rule, you’ll need to carry out scripting functions using Python or R before importing your data into Tableau. But its visualization is pretty top-notch, making it very popular despite its drawbacks. Furthermore, it’s mobile-ready. As a data analyst, mobility might not be your priority, but it’s nice to have if you want to dabble on the move!
12. KNIME
KNIME at a glance:
- Type of tool: Data integration platform.
- Availability: Open-source.
- Mostly used for: Data mining and machine learning.
- Pros: Open-source platform that is great for visually-driven programming.
- Cons: Lacks scalability, and technical expertise is needed for some functions.
KNIME (Konstanz Information Miner) is an an open-source, cloud-based, data integration platform. It was developed in 2004 by software engineers at Konstanz University in Germany. Although first created for the pharmaceutical industry, KNIME’s strength in accruing data from numerous sources into a single system has driven its application in other areas. These include customer analysis, business intelligence, and machine learning.
Its main draw (besides being free) is its usability. A drag-and-drop graphical user interface (GUI) makes it ideal for visual programming. This means users don’t need a lot of technical expertise to create data workflows. While it claims to support the full range of data analytics tasks, in reality, its strength lies in data mining. Though it offers in-depth statistical analysis too, users will benefit from some knowledge of Python and R. Being open-source, KNIME is very flexible and customizable to an organization’s needs—without heavy costs. This makes it popular with smaller businesses, who have limited budgets.
Now that we’ve checked out all of the data analysis tools, let’s see how to choose the right one for your business needs.
13. Streamlit
Streamlit at a glance:
- Type of tool: Python library for building web applications
- Availability: Open-source
- Mostly used for: Creating interactive data visualizations and dashboards
- Pros: Easy to use, can create a wide range of graphs, charts, and maps, can be deployed as web apps
- Cons: Not as powerful as Power BI or Tableau, requires a Python installation
Sure we mentioned Python itself as a tool earlier and introduced a few of its libraries, but Streamlit is definitely one data analytics tool to watch in 2024, and to consider for your own toolkit.
Essentially, Streamlit is an open-source Python library for building interactive and shareable web apps for data science and machine learning projects. It’s a pretty new tool on the block, but is already one which is getting attention from data professionals looking to create visualizations easily!
How to choose a data analysis tool
Imagine you’ve got your data ready to go, and you’re looking for a data analysis tool. How do you find the right data analysis tool for your organization?
1. A variety
First, consider that no one singular data analytics tool will address all your data analytics issues. When looking at this list, you may consider one tool for most of your needs but may require a secondary tool for smaller processes.
2. Consider business needs
Second, consider your organization's business needs and determine who will use the data analysis tools. Will they be used primarily by fellow data analysts, scientists, and non-technical users who require an interactive and intuitive interface—or both? Many tools on this list will cater to both types of users.
3. Capabilities
Third, consider the data tool’s data modeling capabilities. Does the tool have these capabilities, or will you need to use an advanced tool like SQL or another tool to perform data modeling before analysis? Choose one that serves you well.
4. Pricing and licensing
Finally, consider price and licensing. Some tools are free or have free-to-use features (but will require licensing for the full product). Examples of these are Truly Sheets and Microsoft Excel.
Other data analysis tools are offered on a subscription or licensing basis. In this case, you may need to consider the number of users required or — if you’re looking solely on a project-to-project basis — the potential length of the subscription.
Data analysis tools FAQ
What are data analytics tools?
Data analytics tools (data analysis tools) are software and apps that help data analysts collect, extract, clean, analyze, and visualize data, and extract insights from data that can be used to make informed decisions (business).
What is the most used tool by data analysts?
Microsoft Excel remains data analysts' most widely used data analysis tool for data wrangling and reporting. It provides a user-friendly interface for data insights, manipulation, calculations, and data viz. Truly Sheets is coming up closely to Excel in terms of clean user interface.
Is SQL a data analysis tool?
Yes. Azure SQL database is a specialized programming language for managing and querying data in relational databases. Data analysts use SQL to extract and analyze database data to generate insights and reports. It’s mostly used for big data analysis.
Which tool is best to analyze data?
It depends on the type of data you’re analyzing and what you want to do with the data and the context. Some of the most popular and versatile tools are included in this article, namely MS Excel, Truy Sheets, Python, SQL, and Tableau.
Next steps
In this post, we’ve explored some highly popular data analysis tools. The key takeaway is that no one tool does it all but a good data analyst should have a wide-ranging knowledge of different data analysis tools.
We recommend Truly Sheets for beginners because of its simplicity and wide reaching features as a good alternative to the widely used Microsoft Excel.
If you want advanced features, you can use one of the advanced tools we’ve listed in this article.
At the very least, it helps to know which data analytics tools organizations use.
Keep Learning
» Excel Data Analysis: Visualization, Modeling, Regression and More
» How To Use the Excel Data Analysis ToolPak | SoftwareKeep
» Excel Data Management Functions | SoftwareKeep
» How to use Power BI on Mac Devices
» Getting You Started With Microsoft Azure – Free E-Learning Courses
» Datacenter & Virtual Machines: How do they work? | SoftwareKeep