
Excel Functions are the powerhouse tools that elevate your data prowess, enabling you to navigate the sea of information rapidly. Mastering these functions is a must in today's data-driven landscape, where insights steer decisions. Excel Functions are your guiding stars, whether you're tracking expenditures, analyzing trends, or making pivotal forecasts.
This article unveils the top 10 Excel Functions that form the data manipulation and analysis bedrock. Unlocking their potential will empower you to extract meaningful insights and present them flawlessly.
Table of Contents
- SUM Function: Foundation of Calculation
- VLOOKUP Function: Finding and Retrieving Data
- IF Function: Logical Data Handling
- AVERAGE Function: Calculating Central Tendency
- COUNT Function: Quantifying Data Entries
- CONCATENATE Function: Merging Text Strings
- INDEX and MATCH Functions: Advanced Lookup
- SUMIF Function: Conditional Summation
- TEXT Function: Data Formatting Mastery
- PIVOT TABLES: Dynamic Data Analysis
- Final Thoughts
1. SUM Function: Foundation of Calculation
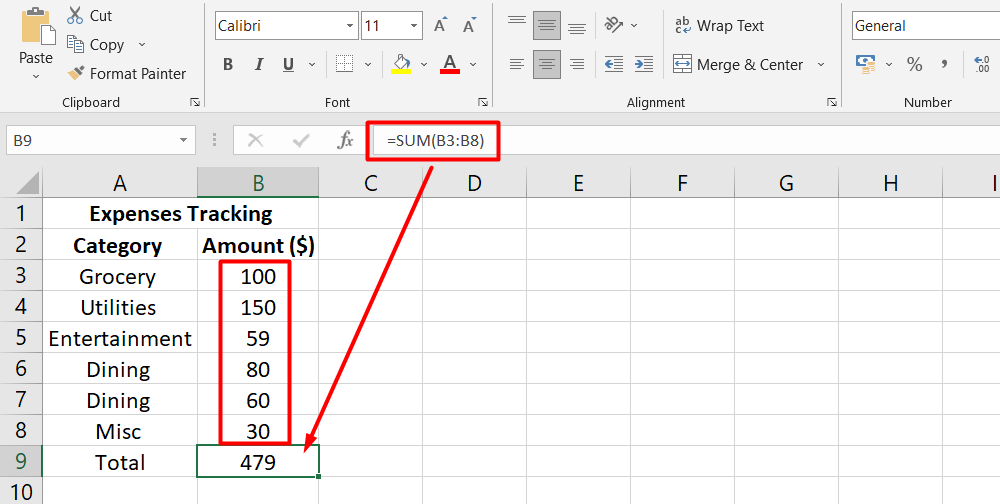
The SUM function in Excel is the digital equivalent of tallying numbers on a calculator, making it remarkably efficient for adding values together. Think of it as your digital assistant that performs the grunt work of adding, allowing you to focus on the bigger picture.
How It Works
Imagine you have a list of numbers in cells A2 to A10. To sum these values, you simply type "=SUM(A2:A10)" in a cell.
It's not just limited to individual values. You can also use cell references or ranges like "B3:B8" in the formula.
Practical Examples
- Basic Totaling: Let's say you're tracking your monthly expenses. You can use SUM to quickly add up your grocery bills, utility payments, and entertainment costs.
- Budgeting Bliss: If you're planning a project budget, SUM can seamlessly calculate costs from various expense categories, giving you a comprehensive overview.
Benefits of SUM Function
- Simplicity: Instead of manually adding rows of numbers, SUM automates the process, saving you time and reducing human error.
- Large Datasets: When dealing with extensive data sets, SUM effortlessly handles the task, eliminating the need for painstaking manual calculations.
- Dynamic Updates: If the values in your cells change, the SUM function dynamically updates the result, keeping your calculations accurate.
2. VLOOKUP Function: Finding and Retrieving Data
Ever felt lost in a labyrinth of data? That's where the VLOOKUP function comes to the rescue. Imagine it as your data GPS, helping you pinpoint information in a sea of numbers and text. Let's break it down:
Introducing VLOOKUP
Think of your data as a treasure map. VLOOKUP is the tool that follows the map's instructions to uncover the treasure—your desired data.
It's ideal for large datasets where manual searching would be a nightmare.
Setting Up VLOOKUP
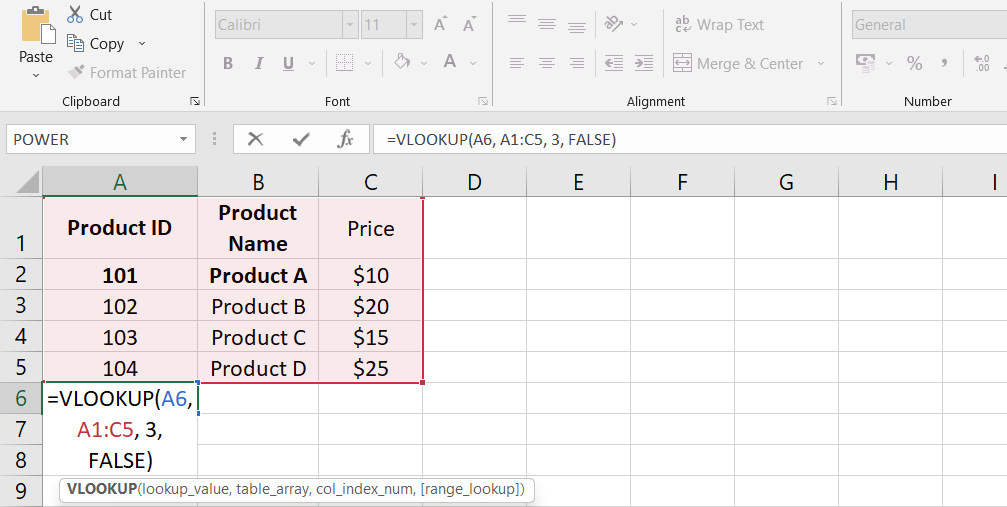
- Formula Entry: Type "=VLOOKUP()" in the Formula Bar.
- Lookup Value: In the parentheses, enter the value you seek, like a product name.
- Table Array: Specify the range of data where you'll hunt for the value, like a list of products.
- Column Index: Define which column in the table contains your desired information.
- Range Lookup: This is your choice between "TRUE" for approximate matches or "FALSE" for exact matches.
Business Scenarios
- Inventory Management: Imagine you manage a warehouse. VLOOKUP can swiftly fetch product details—prices, quantities, and locations.
- Customer Data: In a customer database, plug in a customer ID, and VLOOKUP instantly brings up their contact information, orders, and preferences.
VLOOKUP Rules
- Three vital components: lookup value, table array, and column index number.
- The lookup value must reside in the first column of the lookup table.
- It accommodates various data types, from numbers to text strings.
VLOOKUP with Multiple Criteria
- Sometimes, you need to refine your search. Insert a "helper column" alongside your data.
- Formulate the lookup value by combining criteria—for instance, product and category.
- VLOOKUP then locates matching data based on these compound criteria.
3. IF Function: Logical Data Handling
Imagine Excel as your own virtual decision-maker. The IF function is the wizard behind the curtain, making choices based on conditions you set. Let's unravel its magic:
Understanding the IF Function
- IF is your digital yes-no switch, reacting to your data's condition.
-
It's perfect for scenarios where your actions hinge on specific situations.
Structuring IF Functions
- Formula Beginnings: Start with "=IF(" in a cell's Formula Bar.
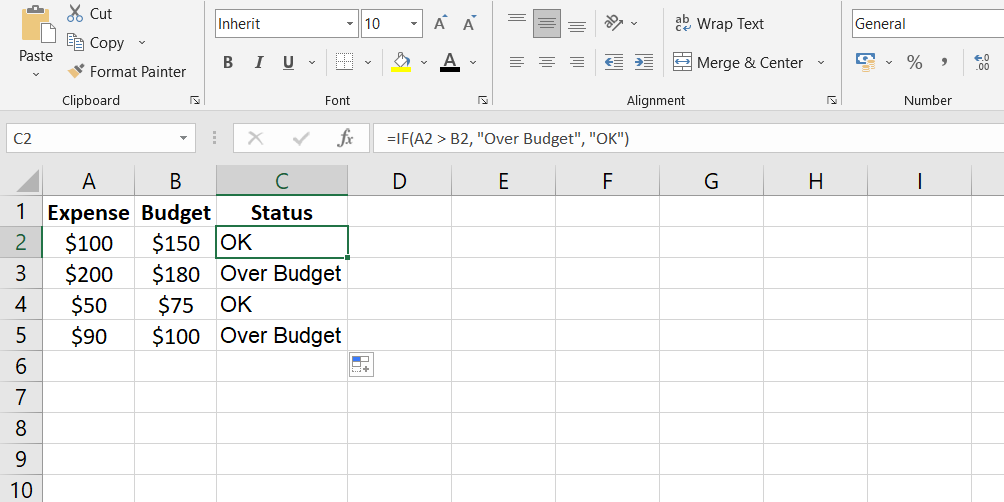
- Condition Check: Enter your condition, like comparing values (A2>B2).
- Outcome If True: Specify what happens if the condition is met, such as "Over Budget."
- Outcome If False: Define the alternative action if the condition isn't satisfied, like "OK."
Significance in Decision-Making
- Budget Assessment: Imagine you're tracking expenses. If costs exceed budget (A2>B2), Excel responds with "Over Budget," else it's "OK."
- Stock Management: If stock levels are low, IF can alert you to reorder, else affirm that it's business as usual.
Syntax Simplified
IF evaluates conditions, returning values based on their truth or falsehood.
Syntax: IF(logical_test, [value_if_true], [value_if_false]).
IF AND Function Combo
- Sometimes, multiple conditions matter. IF AND comes into play.
- Combine the powers of IF and AND to make decisions based on multiple criteria.
- Excel checks all conditions. If they're all met, it says "true," otherwise "false."
4. AVERAGE Function: Calculating Central Tendency
Ever wondered how to make sense of a multitude of numbers? Enter the AVERAGE function—your statistical compass guiding you to the heart of your data's distribution. Let's break it down:
Defining the AVERAGE Function
- The AVERAGE function isn't just a calculator; it's a way to uncover the core of your data.
- Consider it finding the "typical" value amidst a sea of numbers.
Using AVERAGE with Data Ranges
- Data Collection: Imagine you have a range of numbers like 2, 3, and 4.
- Sum and Divide: AVERAGE adds these numbers (2+3+4) and divides the total by the number of observations (3).
-
Result: Voilà! The average of 2, 3, and 4 is 3.
Applications in Data Analysis
- Trend Insights: In business, AVERAGE assesses performance by calculating average sales or expenses, providing an overview of how things are going.
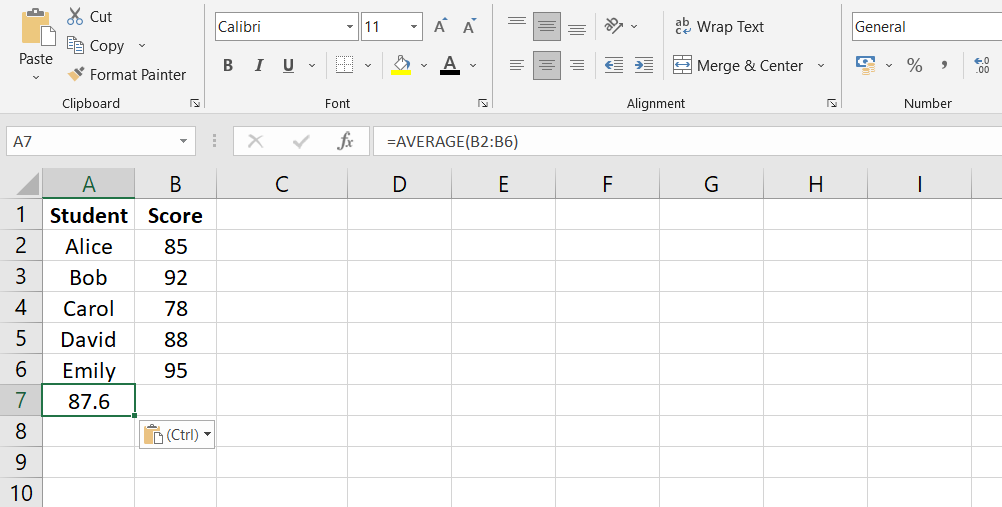
- Academic Analysis: In a classroom, AVERAGE unveils class scores, allowing teachers to gauge students' performance.
Unlocking the AVERAGE Formula
- It's straightforward: =AVERAGE(range) in a cell.
- Excel counts the sum and divides it by the number of values, giving you the mean.
Categorized for Clarity
- The AVERAGE Function falls under Excel's statistical toolkit.
- It calculates the arithmetic mean of a series of numbers, revealing their collective midpoint.
5. COUNT Function: Quantifying Data Entries
Imagine organizing a collection of items and needing to know how many you have. That's where the COUNT function steps in—it's like your digital tally counter, quantifying data entries in a jiffy. Here's how it works:
Introduction to COUNT
- COUNT is like a virtual head counter for cells with values in them.
- It's handy for scenarios where you're curious about the frequency of occurrences.
Handling Different Data Types
- It's versatile! COUNT doesn't just count numbers—it can tally text, dates, and even empty cells.
- Whether it's people, items, or transactions, COUNT captures it all.
Importance in Auditing and Validation
Data Accuracy: COUNT plays a crucial role in auditing by confirming that the number of entries matches expectations.
Data Validation: When dealing with submissions or surveys, COUNT ensures all expected fields are filled.
Using COUNT in Excel
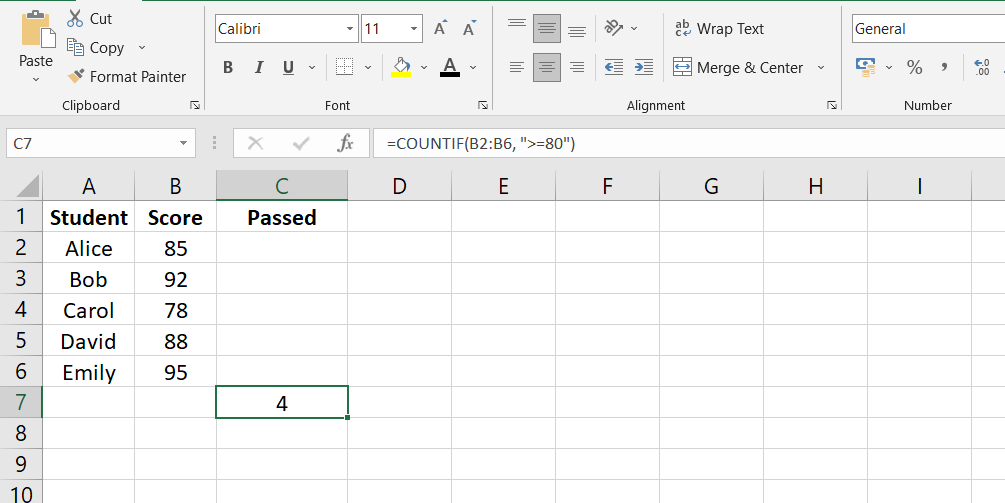
- Basic Count: Say you want to know how many cells in the range A1:A20 have values. Just type "=COUNT(A1:A20)".
- Conditional Count: For more specific counts, like numbers greater than a certain value, you can use COUNTIF.
Variations for Different Needs
- COUNTA: Counts non-empty cells, perfect for assessing data completeness.
- COUNT: Focuses on cells with numbers, helping you understand numeric occurrences.
- COUNTBLANK: Tackles the blank cells, revealing gaps in your data.
- COUNTIF: Acts as a detective, tallying cells that meet specific criteria.
6. CONCATENATE Function: Merging Text Strings
Ever wished you could merge different pieces of text into a single entity? Meet the CONCATENATE function—your digital glue, effortlessly binding text strings together. Here's how it works:
Explaining CONCATENATE
- Imagine it as your text magician, conjuring seamless unions between text cells.
- If you have a name in one cell and a title in another, CONCATENATE marries them into one elegant string.
Syntax and Customization
- Formula Basis: Begin with "=CONCATENATE(" in a cell.
- Text Duo: Add the text or cell references you want to combine, separated by commas.
-
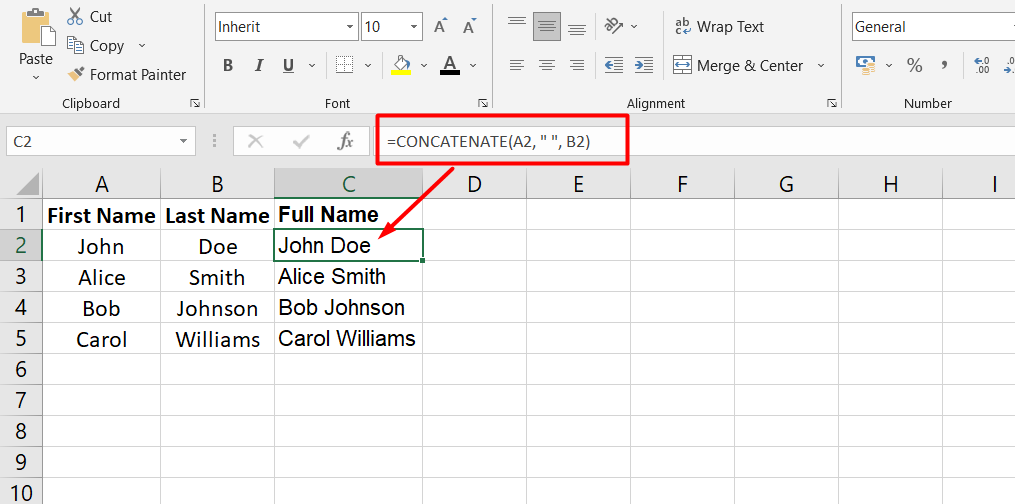
Customization: You can even insert symbols or spaces, like "=CONCATENATE(A1, " - ", B1)".
Instances of CONCATENATE
- Personalized Reports: Create customized reports by joining customer names and their respective transactions.
- Contact Details: Easily craft full addresses by merging street names, cities, and postal codes.
In Layman's Terms
- Step 1: Imagine two cells with names—A1 with "John" and B1 with "Doe".
- Step 2: Type "=CONCATENATE(A1, " ", B1)".
- Step 3: The result? "John Doe" in the new cell.
CONCATENATE Simplified
- It's the digital equivalent of "combining" or "joining."
- It merges different text pieces into a single, comprehensive string.
- You're the creator—CONCATENATE is your tool for crafting text unions that make sense.
7. INDEX and MATCH Functions: Advanced Lookup
Ever wished you had a supercharged search tool capable of diving into data, regardless of its arrangement? Say hello to INDEX and MATCH—a power duo designed for advanced data retrieval. Let's dive in:
Introduction to INDEX and MATCH
- INDEX and MATCH are like Sherlock and Watson, working together to find specific data in a table.
- They outperform VLOOKUP by being flexible in both directions—horizontally and vertically.
Steps to Implement INDEX and MATCH
- INDEX Magic: Use INDEX to fetch an item from a particular spot in a list.
- MATCH Marvel: MATCH pinpoints the position of a value in a list.
-
Combined Brilliance: INDEX and MATCH can hold hands to extract precise data, transcending VLOOKUP's limitations.
Real-World Examples
- Sales Analysis: Imagine you have a vast sales record. INDEX and MATCH dynamically locate sales figures for specific products and time periods.
- Cross-Referencing: INDEX and MATCH navigate through rows and columns to retrieve customer data based on criteria in a database.
Unleash INDEX and MATCH's Power
- Unlike VLOOKUP's left-to-right limitation, INDEX and MATCH can perform bidirectional lookups—left to right or right to left.
- No more rigid column queries—INDEX and MATCH seamlessly delve into both rows and columns.
Putting It Simply
- Step 1: Think of a table with data-filled rows and columns.
- Step 2: Imagine you want to fetch a specific piece of data. Instead of scrolling and squinting, use INDEX and MATCH.
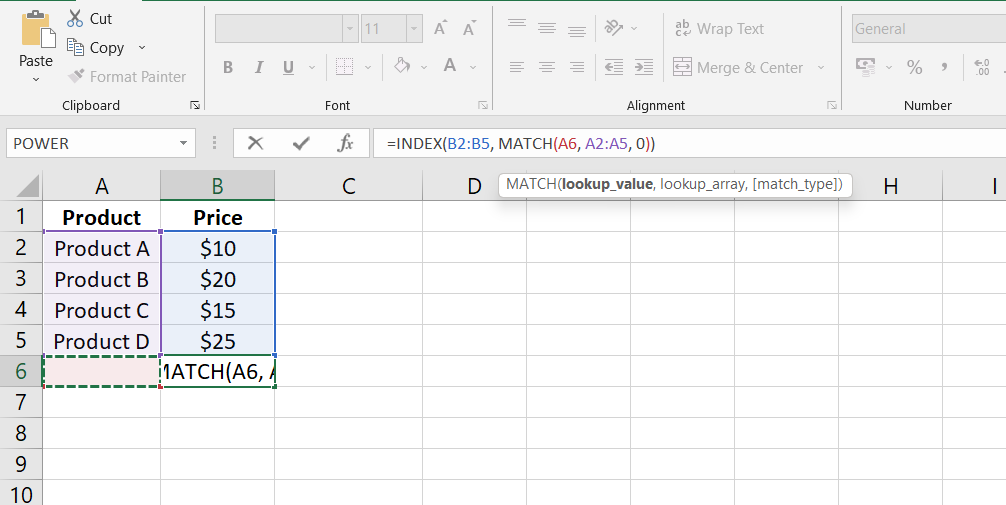
- Step 3: Type "=INDEX(table, MATCH(value, column, 0))", and behold—the data appears.
INDEX and MATCH Demystified
- They're your dynamic detectives, always pinpointing data's exact location.
- Together, they transcend traditional lookup constraints, offering versatility and accuracy.
- INDEX and MATCH—when data hunting requires finesse, they're your trusty companions.
8. SUMIF Function: Conditional Summation
Ever wished you could make Excel smart enough to add only the numbers you need? Enter the SUMIF function—a digital accountant that calculates the sum of specific cells based on your conditions. Let's dive in:
Understanding SUMIF
- SUMIF isn't your everyday calculator—it's a wizard that calculates only when certain criteria are met.
- Consider it as summing up expenses from a specific category rather than just lumping everything together.
Setting Up SUMIF
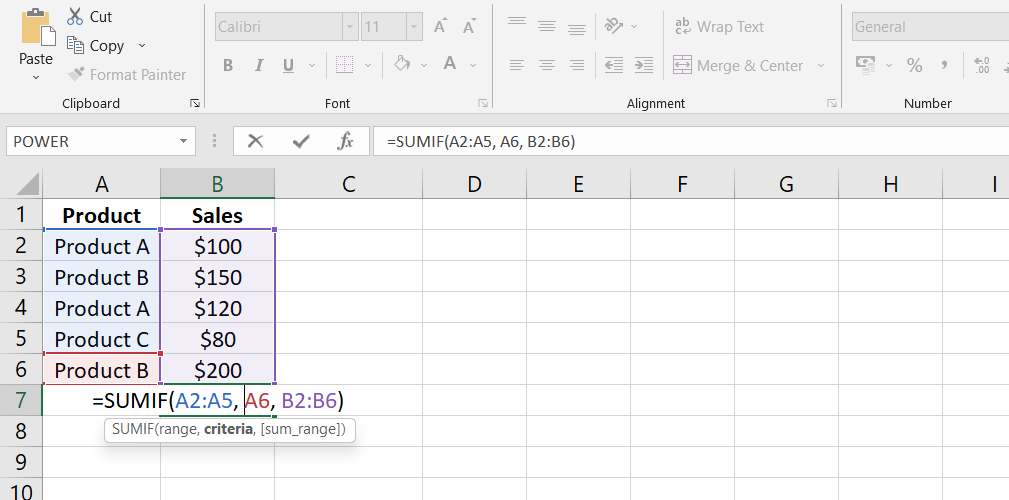
- Basic Formula: Begin with "=SUMIF(" in a cell.
- Criteria Input: Define your condition, like selecting values less than or equal to 12.
- Range Selection: Specify the cell range where you want the sum to happen.
-
Result: SUMIF adds values within the specified range that match your criteria.
Use Cases for Precision
- Expense Tracking: Imagine you have a list of expenses. SUMIF can calculate just the grocery expenses or those by a specific person.
- Targeted Calculations: In sales records, SUMIF can sum up sales from a particular region, month, or product line.
Simplified Syntax
- SUMIF computes the sum based on specific criteria.
- You can also apply the criteria to one range and sum corresponding values from another.
- It's your choice when to apply the rule—no more all-or-nothing adding.
In Everyday Language
- Step 1: Visualize your data—may be expenses or sales records.
- Step 2: Instead of tallying everything, say you want to sum sales by a certain person or products below a certain value.
- Step 3: Use SUMIF: "=SUMIF(range, criteria)" and watch Excel work its magic.
SUMIF Unveiled:
- It's your personal summing assistant that obeys your criteria.
- Forget summing everything—SUMIF lets you extract specific insights from your data.
- When numbers need to add up with a touch of finesse, SUMIF's your go-to function.
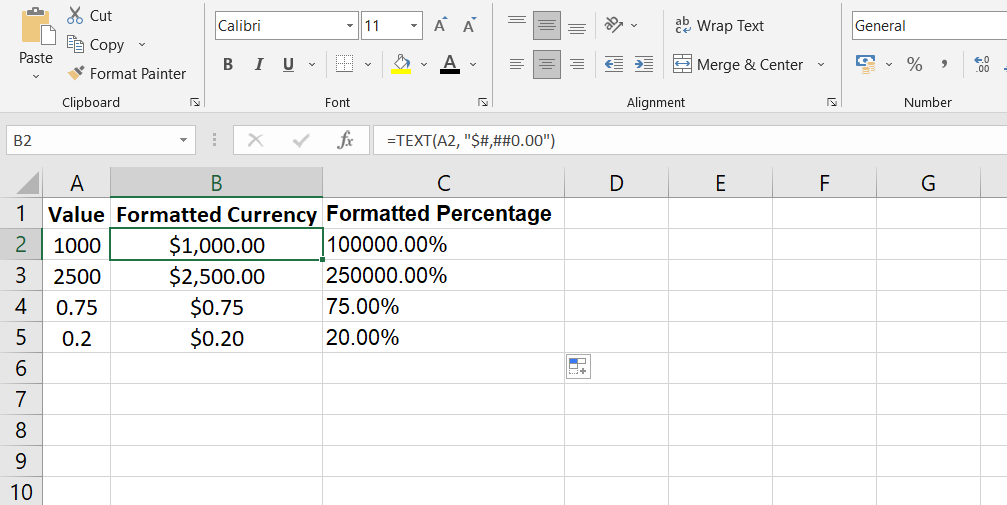
9. TEXT Function: Data Formatting Mastery
Imagine having the power to transform numbers into well-formatted, reader-friendly displays. Meet the TEXT function—a virtual makeover artist for your data. Here's how it works:
Introduction to TEXT
- TEXT is like your data's personal stylist, changing the way numbers and dates appear.
- It's your go-to when you need numbers to speak with the perfect format.
Applying TEXT for Clarity
- Formatting Magic: Use TEXT to craft numbers in the attire you prefer—like adding dollar signs, decimals, or commas.
-
Data Fusion: Mix numbers with text or symbols, presenting information in a unified, coherent manner.
Significance in Data Presentation
- Professional Reports: TEXT ensures consistent data representation in business documents, enhancing the document's appearance.
- Data Communication: Whether in financial statements or project summaries, TEXT adds the polish that makes information shine.
Simplified Usage
- Let's say you have a number like 1000 in a cell.
- Instead of displaying it as 1000, you can use TEXT to show it as "$1,000.00".
10. PIVOT TABLES: Dynamic Data Analysis
Imagine having a tool that could transform your jumbled data into meaningful insights at the snap of your fingers. That's the power of Pivot Tables—a data magician that simplifies complex information and unveils patterns effortlessly. Here's how it works:
Brief on Pivot Tables
Pivot Tables are like your data's magic wand, waving away confusion and revealing clarity.
Their main job? Summarizing and analyzing massive amounts of data in ways that make sense.
Creating Pivot Tables
-
Setup Magic: Create a Pivot Table from your raw data.
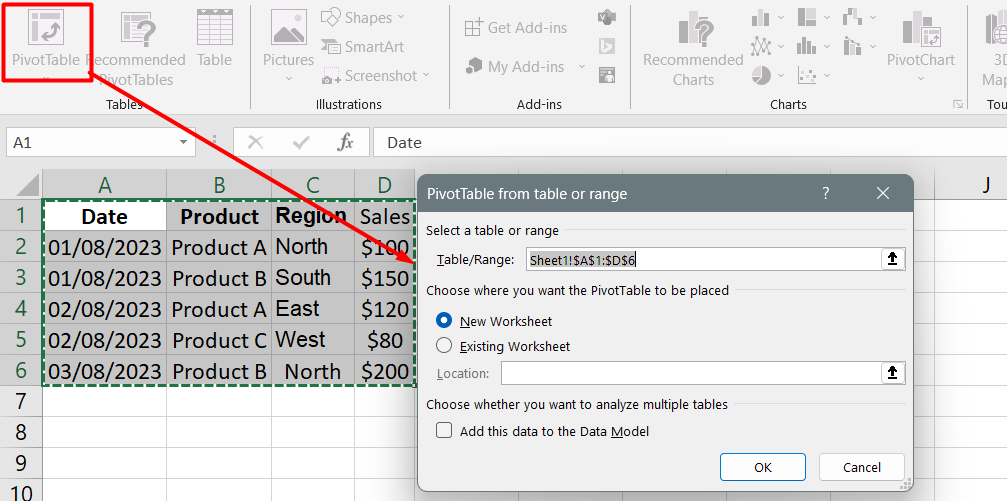
- Field Selection: Handpick the fields you want to analyze—the ones that matter.
- Drag and Drop: Move your chosen fields into rows, columns, and values—forming a new perspective.
Enhancing Data Insights
- Data Exploration: Pivot Tables allow you to dissect data like never before, seeing trends, patterns, and outliers.
- Aggregation Expertise: Summarize numeric data, create custom calculations, and organize data by categories and subcategories.
Final Thoughts
As you journey through Excel's landscape, don't hesitate to explore and master these functions. Their potential lies beyond spreadsheets; they catalyze impactful decision-making, insightful analysis, and crystal-clear presentations.
With these functions at your disposal, you can transform raw data into meaningful insights. So, dive in, experiment, and let these functions elevate your data handling prowess.
Your mastery of Excel's functions will pave the way to data-driven success.
Related Articles
» Excel Quick Analysis Tool: Streamline Data Analysis Effortlessly
» Creating a Data Entry Form in Excel: Simplify Your Data Input Process
» Create a Custom List in Excel | Step-by-Step Guide