Microsoft Excel has many functions, from basic tabulation, to finance, to statistics. The Z-Score is a statistical function and Excel has a built-in tool to help you calculate it.
In this post, we explain how to use Excel to calculate the Z-Score function.

Table of contents
- What is Z-Score?
- The Z-Score Formula
- How to calculate the Z-Score in Excel
- Step #1:Calculate the Mean (or average)
- Step #2: Calculate the Standard Deviation (SD)
- Step #3: Calculate the Z-Score in Excel
- Wrapping UP
What is Z-Score?
The Z-Score is a statistical value used for statistical measurement. It is also known as the standard score. Simply put, a z-score tells you how far from the mean a data point is.
Statistically, the value of a Z-Score is the measure of the number of standard deviations a raw score is below or above the population mean.
Placed on a normal distribution curve, a z-score will range from -3 standard deviations to +3 standard deviations. To use a z-score, you need to know:
- The mean (μ)
- The population standard deviation (σ)
- A raw score (x) or the value to be standardized
The Z-Score Formula
To calculate the z-score use this formula is: Z = (x-µ) / σ
Where the arguments are:
- Z = is the Z score value.
- X = is the value to be standardized (the raw score/data point).
- µ = is the population Mean of the given data set values.
- σ = is the Standard deviation of the give data set values.
How to calculate the Z-Score in Excel
Calculating the z-score in Excel is simple, regardless of the version of Excel you use or the size of your dataset.
Note:
- To calculate the z-score you need to already have the population mean and the standard deviation. If you only have the data set values, you need to calculate the two values first and then calculate the z-score.
- If you don’t know the population standard deviation or the sample size is below 6, you should use a t-score instead of a z-score.
There are two ways to calculate the Z-Score core in Excel
- By manually entering the Z scores formula.
- Using the STANDARDIZE formula in Excel.
As an example, here’s the data set that we will be using:
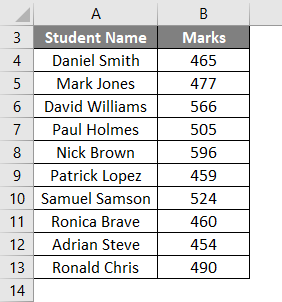
Step #1:Calculate the Mean (or average)
You can easily calculate the mean using the AVERAGE formula in Excel.
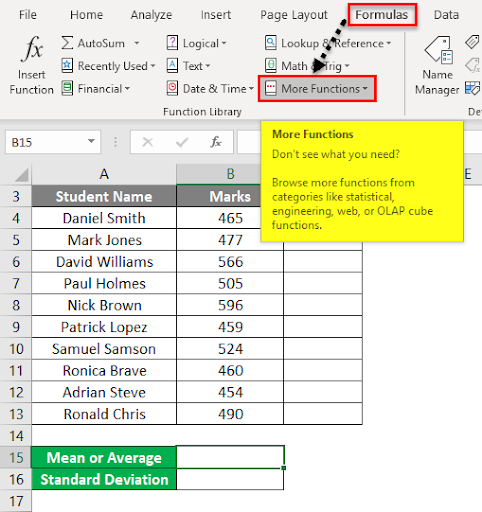
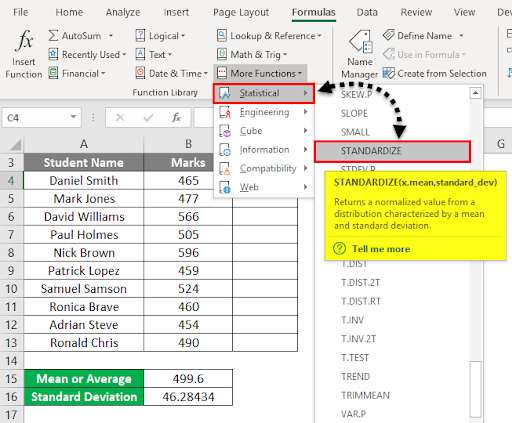
- Go to the Formulas tab.
-
Click on More Functions under the Functions Library section.

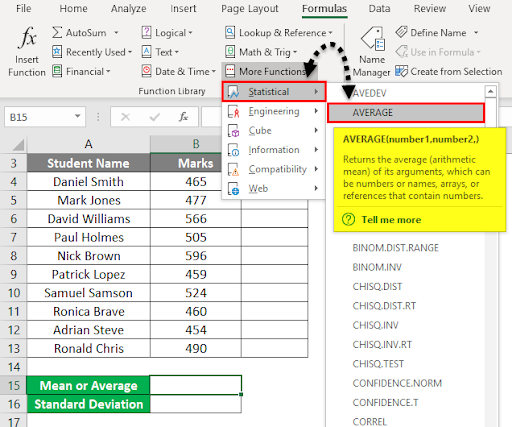
- From the dropdown list, click on the Statistical functions category.
-
From the list of functions, click on the AVERAGE function.

-
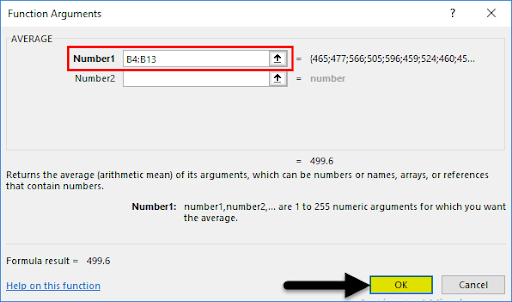
In the Function Arguments dialog box, enter the Range from Cells B4:B13 under field Number1 and click on OK.
-
It will give you the Mean or Average value.
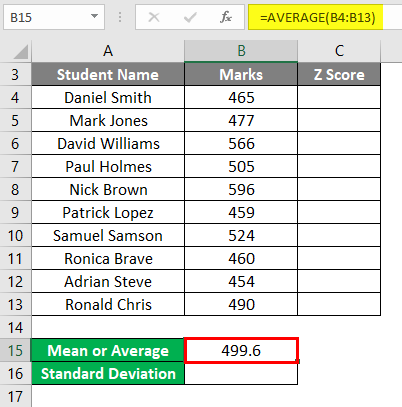
- The mean is 499.6 (or µ =499.6)
Alternatively: you can calculate the mean with the formula =AVERAGE(number1).
You can select the whole data set then number1 with the range of cells containing the data.
For example, =AVERAGE(B4:B13: The mean (average) wil be499.6 (µ =499.6)
Step #2: Calculate the Standard Deviation (SD)
To calculate the SD, you can use the STDEV formula in Excel. This formula is identical to the STDEV.S formula since it calculates the SD of the sample.
Note: if you want to calculate the SD of the population, you should use the STDEV.P formula instead.
To calculate the SD:
- Go to the Formulas tab.
-
Click More Functions under the Function Library section.
- From the drop-down list, click on the Statistical Function category.
-
From the list of functions, click on STDEVPA.
-
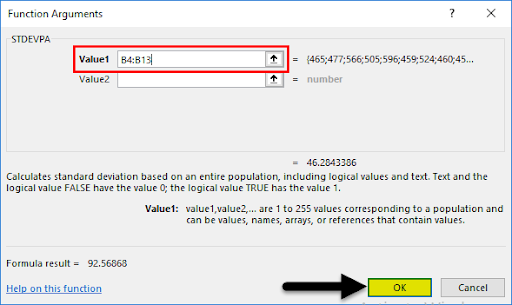
In the Function Arguments dialog box, enter the cells range from B4:B13 under field Value1 and click on OK.
-
This will give you the SD value
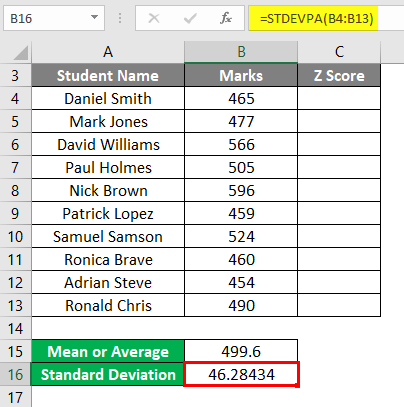
- The SD (σ) = 46.2843
Alternatively: you can calculate the SD by entering the formula.
In a new cell enter the formula =STDEV(number1) and replace number1 with the range of cells containing the data (B4:B13), i.e. =STDEV(B4:B13).
- The SD (σ) = 46.2843
Now, we have the Mean and SD. we can calculate the z-score manually in Excel.
Step #3: Calculate the Z-Score in Excel
To calculate the z-score:
- Go to the FORMULAS tab.
-
Under the Functions Library, click on More Functions

- From the drop-down list, click on the Statistical Function category.
-
From the list of functions, click on the STANDARDIZE function.
-
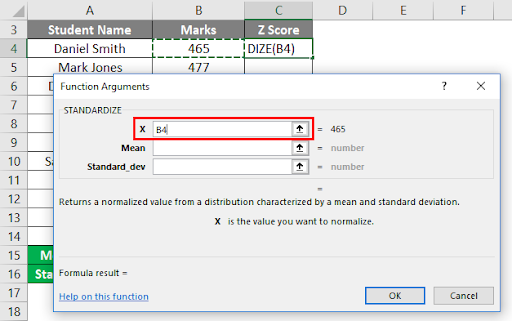
In the Function Arguments dialog box, enter the Cell value B4 under field X.
-
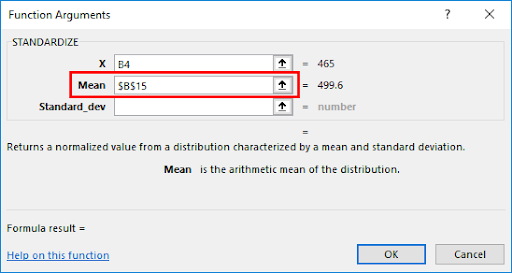
Enter the Mean value in the second field Mean (in our case it is mentioned under Cell B15).
-
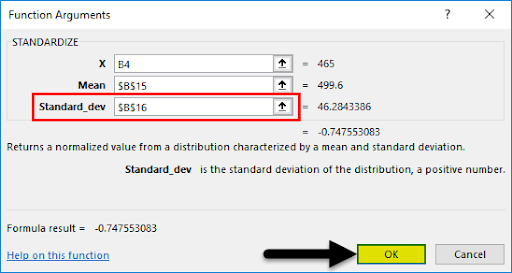
Enter the SD value in the third field Standard_dev (in our case it is mentioned under Cell B16, then Click on OK.
-
This will give you the result of the z-score for the first data set
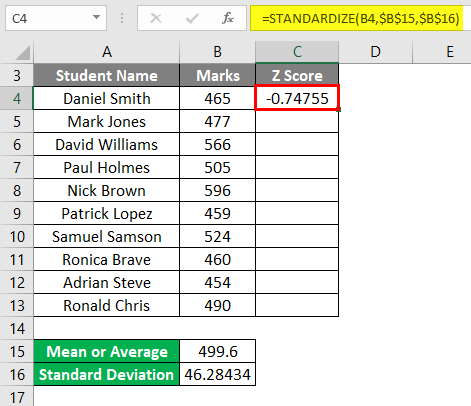
- To get the z-score values of all the other data sets, drag his formula for the rest values. The z-score values will pop-up beside every value.
Alternatively: you can calculate the z-score by entering the formula:
-
In an empty cell, preferably next to the raw data value, enter the formula:
=(Raw data value - Mean)/SD - Replace the following in the equation with:
- Raw data value – This is the cell containing original data value that you want to convert to a Z score
- Mean – The cell containing the mean value of the data set
- SD – The cell containing the SD of the data set
- The z-score will come as -0.74755
- Drag the formula through all the data sets to get the rest of the z-score values
Wrapping UP
Here are the things to remember
- The Z score tells us a number of standard deviations that are away from the mean of the distribution or dataset.
- Data values which are higher than the mean, have a positive Z-score value.
- Data values that are below the mean, have a negative Z score value.
- The Z score value is used for statistical analysis.
In this guide to Z-Score in Excel, we’ve discussed how to calculate Z Score in excel along with practical examples. We believe it has been an insightful learning opportunity.
If you’re looking for more guides or want to read more Excel, and tech-related articles, consider subscribing to our newsletter where we regularly publish tutorials, news articles, and guides.
Recommended Articles
You can also go through the following articles to learn more about Excel: